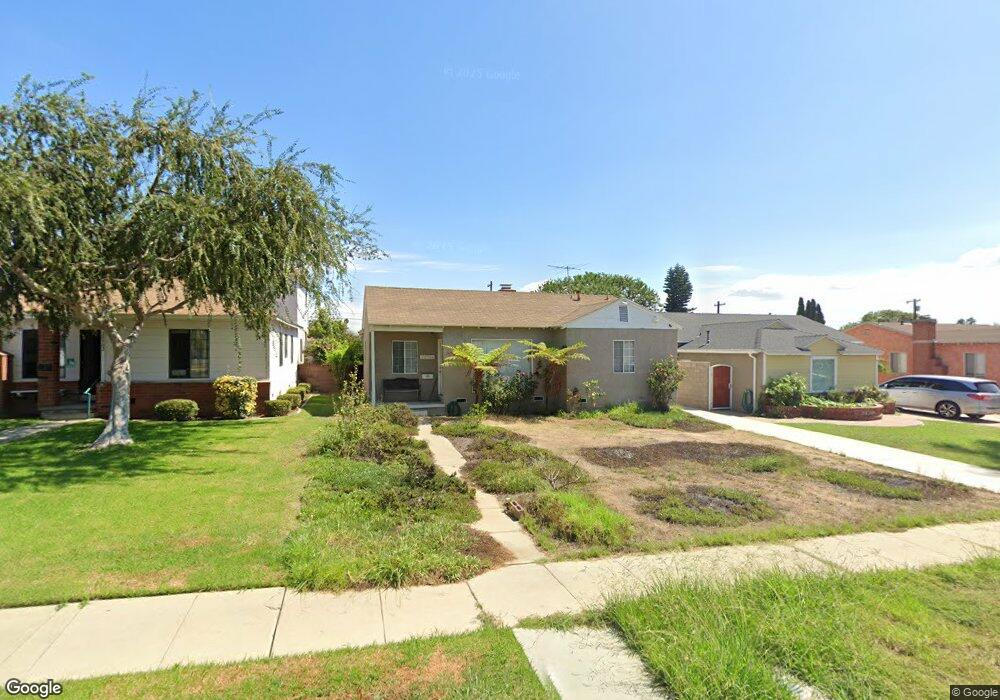
20906 Denker Ave Torrance, CA 90501
Harbor Gateway NeighborhoodEstimated Value: $784,600 - $877,000
3
Beds
1
Bath
1,020
Sq Ft
$817/Sq Ft
Est. Value
About This Home
This home is located at 20906 Denker Ave, Torrance, CA 90501 and is currently estimated at $833,400, approximately $817 per square foot. 20906 Denker Ave is a home located in Los Angeles County with nearby schools including Halldale Elementary School, Stephen M. White Middle School, and Nathaniel Narbonne Senior High School.
Ownership History
Date
Name
Owned For
Owner Type
Purchase Details
Closed on
Sep 4, 2003
Sold by
Hendricks Norman D and Hendricks Danita M
Bought by
Betonio Emmanuel P
Current Estimated Value
Home Financials for this Owner
Home Financials are based on the most recent Mortgage that was taken out on this home.
Original Mortgage
$280,000
Outstanding Balance
$129,713
Interest Rate
6.22%
Mortgage Type
Purchase Money Mortgage
Estimated Equity
$703,687
Purchase Details
Closed on
Feb 15, 1994
Sold by
Loney William Richard
Bought by
Loney Wanda L
Purchase Details
Closed on
Oct 14, 1993
Sold by
Ross James Gary and Loney Wanda L
Bought by
Hendricks Norman D
Home Financials for this Owner
Home Financials are based on the most recent Mortgage that was taken out on this home.
Original Mortgage
$161,385
Interest Rate
6.98%
Mortgage Type
Assumption
Create a Home Valuation Report for This Property
The Home Valuation Report is an in-depth analysis detailing your home's value as well as a comparison with similar homes in the area
Home Values in the Area
Average Home Value in this Area
Purchase History
| Date | Buyer | Sale Price | Title Company |
|---|---|---|---|
| Betonio Emmanuel P | $350,000 | Gateway Title | |
| Loney Wanda L | -- | North American Title Company | |
| Ross James Gary | -- | North American Title Company | |
| Hendricks Norman D | -- | North American Title Company |
Source: Public Records
Mortgage History
| Date | Status | Borrower | Loan Amount |
|---|---|---|---|
| Open | Betonio Emmanuel P | $280,000 | |
| Previous Owner | Hendricks Norman D | $161,385 | |
| Closed | Betonio Emmanuel P | $52,500 |
Source: Public Records
Tax History Compared to Growth
Tax History
| Year | Tax Paid | Tax Assessment Tax Assessment Total Assessment is a certain percentage of the fair market value that is determined by local assessors to be the total taxable value of land and additions on the property. | Land | Improvement |
|---|---|---|---|---|
| 2025 | $6,249 | $497,606 | $398,092 | $99,514 |
| 2024 | $6,249 | $487,850 | $390,287 | $97,563 |
| 2023 | $6,129 | $478,285 | $382,635 | $95,650 |
| 2022 | $5,848 | $468,908 | $375,133 | $93,775 |
| 2021 | $5,774 | $459,715 | $367,778 | $91,937 |
| 2019 | $5,603 | $446,081 | $356,870 | $89,211 |
| 2018 | $5,539 | $437,335 | $349,873 | $87,462 |
| 2016 | $5,291 | $420,355 | $336,288 | $84,067 |
| 2015 | $5,020 | $398,000 | $318,000 | $80,000 |
| 2014 | $4,597 | $354,000 | $283,000 | $71,000 |
Source: Public Records
Map
Nearby Homes
- 20907 Halldale Ave
- 1566 W 208th St
- 1601 Torrance Blvd
- 1514 W 207th St Unit C
- 21114 La Salle Ave
- 1629 W 208th St
- 20813 Normandie Ave
- 1667 W 208th St
- 21125 Normandie Ave
- 1636 W 205th St
- 21322 Denker Ave
- 20315 Denker Ave Unit 28
- 20315 Denker Ave Unit 11
- 1668 W 213th St
- 20612 Kenwood Ave
- 1291 Bonnet Way
- 1551 Del Amo Blvd
- 1145 Milton St
- 20710 Raymond Ave
- 20414 Kenwood Ave
- 20912 Denker Ave
- 20902 Denker Ave
- 20916 Denker Ave
- 20907 Dalton Ave
- 20913 Dalton Ave
- 20903 Dalton Ave
- 20920 Denker Ave
- 20856 Denker Ave
- 20917 Dalton Ave
- 20926 Denker Ave
- 20921 Dalton Ave
- 20857 Dalton Ave
- 20852 Denker Ave
- 20907 Denker Ave
- 20901 Denker Ave
- 20911 Denker Ave
- 20927 Dalton Ave
- 20853 Dalton Ave
- 20915 Denker Ave
- 20930 Denker Ave