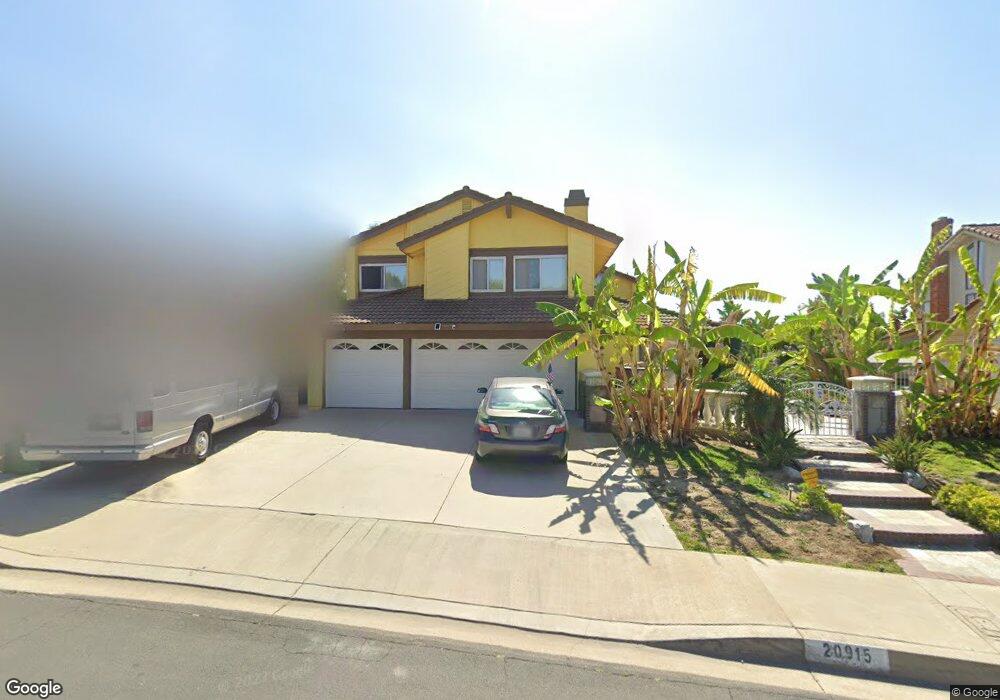
20915 Running Branch Rd Diamond Bar, CA 91765
Estimated Value: $1,986,000 - $2,222,000
7
Beds
6
Baths
4,107
Sq Ft
$506/Sq Ft
Est. Value
About This Home
This home is located at 20915 Running Branch Rd, Diamond Bar, CA 91765 and is currently estimated at $2,077,168, approximately $505 per square foot. 20915 Running Branch Rd is a home located in Los Angeles County with nearby schools including Castle Rock Elementary School, South Pointe Middle School, and Diamond Bar High School.
Ownership History
Date
Name
Owned For
Owner Type
Purchase Details
Closed on
Jun 22, 2021
Sold by
Wang Angelique
Bought by
Cui Wei
Current Estimated Value
Purchase Details
Closed on
Feb 25, 2020
Sold by
Cui Wei
Bought by
Wang Michelle
Purchase Details
Closed on
Jun 13, 2013
Sold by
Wang Yufen
Bought by
Cui Wei
Home Financials for this Owner
Home Financials are based on the most recent Mortgage that was taken out on this home.
Original Mortgage
$645,000
Interest Rate
4.46%
Mortgage Type
Credit Line Revolving
Purchase Details
Closed on
Nov 17, 2009
Sold by
Chan Tak Ming
Bought by
Cui Wei and Wang Yufen
Purchase Details
Closed on
Dec 24, 2008
Sold by
Chan Zoe and Chan Ming Tak
Bought by
Chan Ming Tak
Create a Home Valuation Report for This Property
The Home Valuation Report is an in-depth analysis detailing your home's value as well as a comparison with similar homes in the area
Home Values in the Area
Average Home Value in this Area
Purchase History
| Date | Buyer | Sale Price | Title Company |
|---|---|---|---|
| Cui Wei | -- | Old Republic Title | |
| Wang Michelle | -- | None Available | |
| Cui Wei | -- | Fatcola | |
| Cui Wei | -- | Investors Title Company | |
| Chan Ming Tak | -- | None Available |
Source: Public Records
Mortgage History
| Date | Status | Borrower | Loan Amount |
|---|---|---|---|
| Previous Owner | Cui Wei | $645,000 |
Source: Public Records
Tax History Compared to Growth
Tax History
| Year | Tax Paid | Tax Assessment Tax Assessment Total Assessment is a certain percentage of the fair market value that is determined by local assessors to be the total taxable value of land and additions on the property. | Land | Improvement |
|---|---|---|---|---|
| 2025 | $18,276 | $1,524,429 | $874,915 | $649,514 |
| 2024 | $18,276 | $1,494,539 | $857,760 | $636,779 |
| 2023 | $17,788 | $1,465,236 | $840,942 | $624,294 |
| 2022 | $17,374 | $1,436,506 | $824,453 | $612,053 |
| 2021 | $17,052 | $1,408,340 | $808,288 | $600,052 |
| 2020 | $13,108 | $1,069,129 | $378,863 | $690,266 |
| 2019 | $12,858 | $1,048,167 | $371,435 | $676,732 |
| 2018 | $12,338 | $1,027,615 | $364,152 | $663,463 |
| 2016 | $11,413 | $987,712 | $350,012 | $637,700 |
| 2015 | $11,485 | $972,877 | $344,755 | $628,122 |
| 2014 | $11,495 | $953,820 | $338,002 | $615,818 |
Source: Public Records
Map
Nearby Homes
- 20905 Running Branch Rd
- 3702 Crooked Creek Dr
- 21307 Chirping Sparrow Rd
- 21187 Ambushers St
- 3201 Marigold Cir
- 20610 E Oak Meadow Ln
- 21533 Ambushers St
- 2968 Crooked Creek Dr
- 3005 La Paz Ln Unit C
- 2905 Yucatan Place Unit A
- 2990 Malaga Cir Unit C
- 2828 Water Course Dr
- 3145 Steeplechase Ln
- 2945 Steeplechase Ln
- 21128 Trigger Ln
- 2831 Steeplechase Ln
- 20374 Portside Dr
- 2887 Shadow Canyon Rd
- 2710 Castle Rock Rd
- 2820 Shadow Canyon Rd
- 20925 Running Branch Rd
- 20935 Running Branch Rd
- 20930 Running Branch Rd
- 20920 Running Branch Rd
- 20910 Running Branch Rd
- 20945 Running Branch Rd
- 20940 Running Branch Rd
- 20955 Running Branch Rd
- 3660 Greyfield Ln
- 20960 Running Branch Rd
- 3655 Greyfield Ln
- 20965 Running Branch Rd
- 3650 Greyfield Ln
- 20970 Running Branch Rd
- 20975 Running Branch Rd
- 3645 Greyfield Ln
- 21010 Chirping Sparrow Rd
- 21030 Chirping Sparrow Rd
- 20985 Running Branch Rd
- 21070 Chirping Sparrow Rd