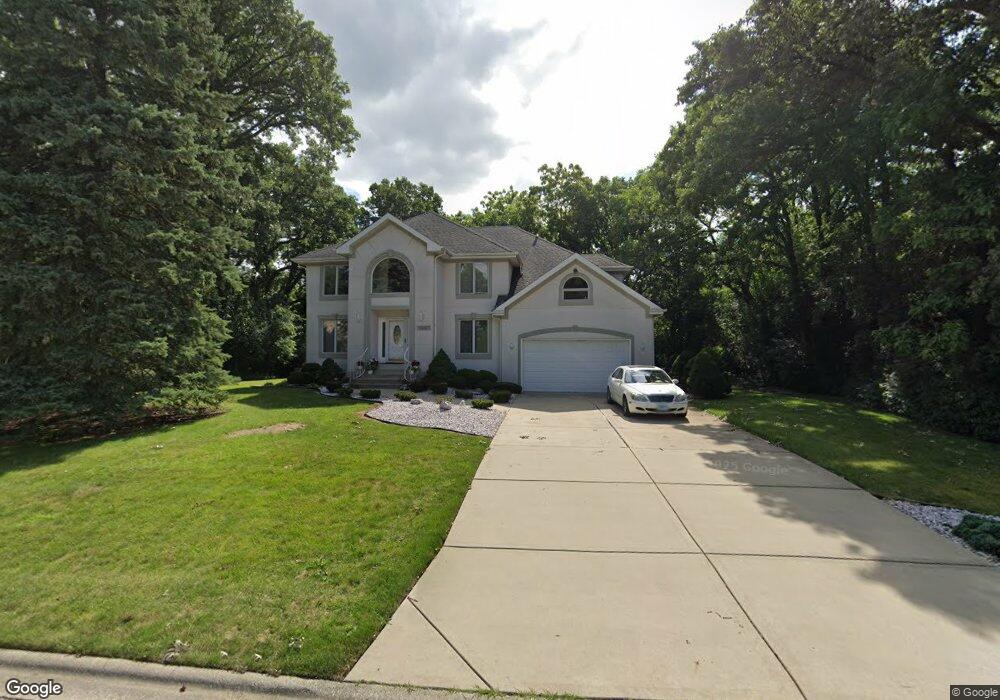
20917 Brookside Blvd Olympia Fields, IL 60461
Estimated Value: $371,984 - $435,000
3
Beds
3
Baths
2,911
Sq Ft
$140/Sq Ft
Est. Value
About This Home
This home is located at 20917 Brookside Blvd, Olympia Fields, IL 60461 and is currently estimated at $407,746, approximately $140 per square foot. 20917 Brookside Blvd is a home located in Cook County with nearby schools including Illinois School, Indiana Elementary School, and Arcadia Elementary School.
Ownership History
Date
Name
Owned For
Owner Type
Purchase Details
Closed on
Jul 15, 2013
Sold by
Bank Financial Fsb
Bought by
Thrailkill Eva M and Thrailkill Brian
Current Estimated Value
Purchase Details
Closed on
Apr 21, 2008
Sold by
Standard Bank & Trust Co
Bought by
Bank Financial and Trust #010410
Purchase Details
Closed on
Mar 30, 2004
Sold by
Bank Financial Fsb
Bought by
Standard Bank & Trust Co and Trust #18167
Purchase Details
Closed on
Dec 9, 2003
Sold by
Thrailkill Eva M
Bought by
Bankfinancial Fsb and Trust #010410
Purchase Details
Closed on
Sep 29, 1998
Sold by
Bank Calumet Na
Bought by
Thrailkill Eva M
Home Financials for this Owner
Home Financials are based on the most recent Mortgage that was taken out on this home.
Original Mortgage
$95,000
Interest Rate
6.72%
Create a Home Valuation Report for This Property
The Home Valuation Report is an in-depth analysis detailing your home's value as well as a comparison with similar homes in the area
Home Values in the Area
Average Home Value in this Area
Purchase History
| Date | Buyer | Sale Price | Title Company |
|---|---|---|---|
| Thrailkill Eva M | -- | None Available | |
| Bank Financial | -- | None Available | |
| Standard Bank & Trust Co | -- | -- | |
| Bankfinancial Fsb | -- | -- | |
| Thrailkill Eva M | $100,000 | Professional National Title |
Source: Public Records
Mortgage History
| Date | Status | Borrower | Loan Amount |
|---|---|---|---|
| Previous Owner | Thrailkill Eva M | $95,000 |
Source: Public Records
Tax History
| Year | Tax Paid | Tax Assessment Tax Assessment Total Assessment is a certain percentage of the fair market value that is determined by local assessors to be the total taxable value of land and additions on the property. | Land | Improvement |
|---|---|---|---|---|
| 2025 | $4,365 | $30,000 | $9,640 | $20,360 |
| 2024 | $4,365 | $30,000 | $9,640 | $20,360 |
| 2023 | $5,877 | $30,000 | $9,640 | $20,360 |
| 2022 | $5,877 | $20,253 | $8,325 | $11,928 |
| 2021 | $5,679 | $20,252 | $8,325 | $11,927 |
| 2020 | $4,836 | $20,252 | $8,325 | $11,927 |
| 2019 | $5,078 | $17,235 | $7,448 | $9,787 |
| 2018 | $5,035 | $17,235 | $7,448 | $9,787 |
| 2017 | $4,934 | $17,235 | $7,448 | $9,787 |
| 2016 | $6,657 | $19,173 | $6,572 | $12,601 |
| 2015 | $6,971 | $19,173 | $6,572 | $12,601 |
| 2014 | $6,867 | $19,173 | $6,572 | $12,601 |
| 2013 | $10,055 | $25,159 | $6,572 | $18,587 |
Source: Public Records
Map
Nearby Homes
- 442 Homan Ave
- 126 Indiana St
- 20869 Greenwood Dr
- 2935 Dartmouth Ln
- 2925 Dartmouth Ln
- 417 New Salem St
- 332 Gentry St
- 331 Gentry St
- 303 Jackson St
- 21142 Locust St
- 30 Strauss Ln
- 3719 211th Place
- 20535 Marathon Ct
- 3421 Station Dr
- 20436 Arcadian Dr
- 888 Woodstock Rd
- 21220 Tower Ave
- 20415 Doria Ln
- 2700 Chariot Ln
- 20319 Harding Ave
- 3215 Brookside Blvd
- 20940 Indiana Cir
- 20921 Brookside Blvd
- 20905 Brookside Blvd
- 20930 Brookside Blvd
- 20845 Brookside Blvd
- 3205 Brookside Blvd
- 20865 Tower Cir Unit 4
- 3235 Thaxted Cir
- 20920 Brookside Blvd
- 20910 Brookside Blvd
- 20900 Brookside Blvd
- 3230 Thaxted Cir
- 3220 Brookside Blvd
- 3155 London Dr
- 3245 Thaxted Cir
- 3210 Brookside Blvd
- 20935 Indiana Cir
- 20850 Brookside Blvd
- 3200 Brookside Blvd
Your Personal Tour Guide
Ask me questions while you tour the home.