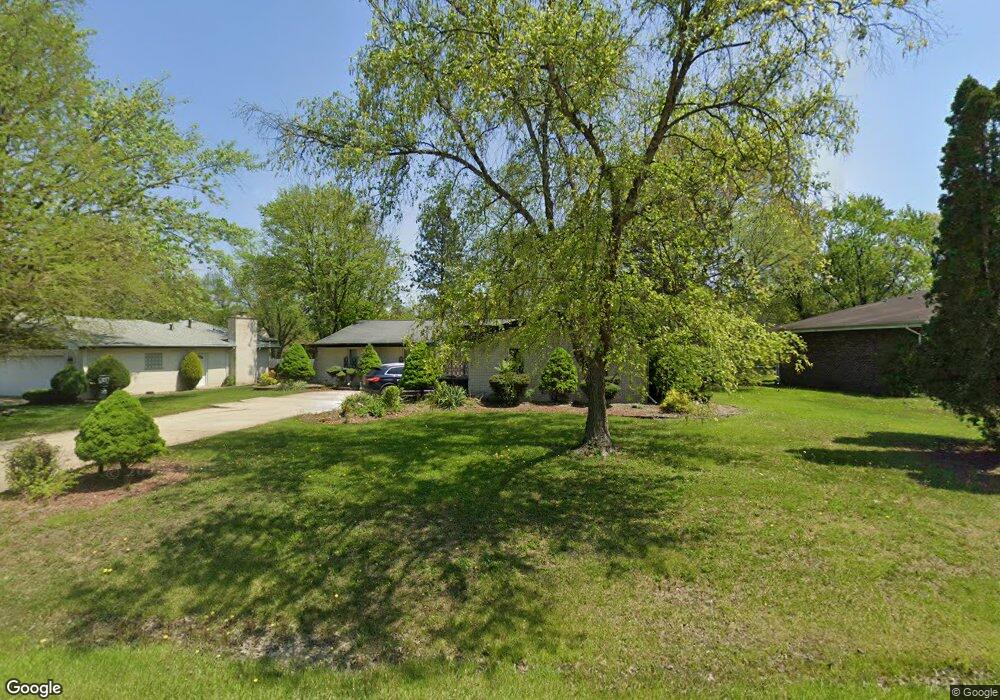
20917 Corinth Rd Olympia Fields, IL 60461
Estimated Value: $301,628 - $390,000
4
Beds
3
Baths
1,965
Sq Ft
$170/Sq Ft
Est. Value
About This Home
This home is located at 20917 Corinth Rd, Olympia Fields, IL 60461 and is currently estimated at $333,407, approximately $169 per square foot. 20917 Corinth Rd is a home located in Cook County with nearby schools including Illinois School, Indiana Elementary School, and Arcadia Elementary School.
Ownership History
Date
Name
Owned For
Owner Type
Purchase Details
Closed on
Jun 24, 2005
Sold by
Nelson Rosiland
Bought by
Nelson Rosiland and Nelson Patricia
Current Estimated Value
Purchase Details
Closed on
Dec 16, 2004
Sold by
Eenigenburg Keith
Bought by
Nelson Rosiland
Home Financials for this Owner
Home Financials are based on the most recent Mortgage that was taken out on this home.
Original Mortgage
$215,910
Interest Rate
8%
Mortgage Type
Unknown
Purchase Details
Closed on
Mar 29, 2004
Sold by
Bank Calumet
Bought by
Ktk Enterprises
Purchase Details
Closed on
Jan 6, 1997
Sold by
Greatbanc Trust Company
Bought by
Hutton Lt and Hutton Mary
Home Financials for this Owner
Home Financials are based on the most recent Mortgage that was taken out on this home.
Original Mortgage
$125,000
Interest Rate
7.5%
Create a Home Valuation Report for This Property
The Home Valuation Report is an in-depth analysis detailing your home's value as well as a comparison with similar homes in the area
Home Values in the Area
Average Home Value in this Area
Purchase History
| Date | Buyer | Sale Price | Title Company |
|---|---|---|---|
| Nelson Rosiland | -- | Chicago Title Insurance Comp | |
| Nelson Rosiland | $240,000 | Pntn | |
| Ktk Enterprises | $228,000 | Atgf Inc | |
| Hutton Lt | $220,000 | -- |
Source: Public Records
Mortgage History
| Date | Status | Borrower | Loan Amount |
|---|---|---|---|
| Previous Owner | Nelson Rosiland | $215,910 | |
| Previous Owner | Hutton Lt | $125,000 | |
| Closed | Nelson Rosiland | $11,995 |
Source: Public Records
Tax History Compared to Growth
Tax History
| Year | Tax Paid | Tax Assessment Tax Assessment Total Assessment is a certain percentage of the fair market value that is determined by local assessors to be the total taxable value of land and additions on the property. | Land | Improvement |
|---|---|---|---|---|
| 2024 | $9,436 | $25,000 | $7,059 | $17,941 |
| 2023 | $7,799 | $25,000 | $7,059 | $17,941 |
| 2022 | $7,799 | $17,153 | $6,275 | $10,878 |
| 2021 | $7,790 | $17,152 | $6,274 | $10,878 |
| 2020 | $7,238 | $17,152 | $6,274 | $10,878 |
| 2019 | $8,172 | $19,024 | $5,882 | $13,142 |
| 2018 | $8,111 | $19,024 | $5,882 | $13,142 |
| 2017 | $7,871 | $19,024 | $5,882 | $13,142 |
| 2016 | $7,829 | $18,088 | $5,490 | $12,598 |
| 2015 | $7,741 | $18,088 | $5,490 | $12,598 |
| 2014 | $7,593 | $18,088 | $5,490 | $12,598 |
| 2013 | $8,143 | $20,876 | $5,490 | $15,386 |
Source: Public Records
Map
Nearby Homes
- 21008 Apollo Cir
- 20832 Sparta Ln
- 338 Farragut St
- 417 New Salem St
- 2925 Dartmouth Ln
- 332 Gentry St
- 2935 Dartmouth Ln
- 2700 Chariot Ln
- 244 Thomas St
- 2716 Chariot Ln
- 312 Illinois St
- 315 Illinois St
- 411 Seward St
- 325 Indiana St
- 310 New Salem St
- 410 Todd St
- 300 Indiana St
- 213 Berry St
- 302 Springfield St
- 2312 209th St
- 20911 Corinth Rd
- 20925 Corinth Rd
- 20901 Corinth Rd
- 20933 Corinth Rd Unit 1096
- 20916 Sparta Ln
- 20924 Sparta Ln
- 20908 Sparta Ln
- 20916 Corinth Rd
- 20924 Corinth Rd
- 20849 Corinth Rd
- 20908 Corinth Rd
- 2671 Corinth Rd
- 20932 Corinth Rd
- 20900 Sparta Ln
- 20932 Sparta Ln
- 20940 Corinth Rd
- 20900 Corinth Rd
- 20841 Corinth Rd
- 20848 Sparta Ln
- 2661 Corinth Rd