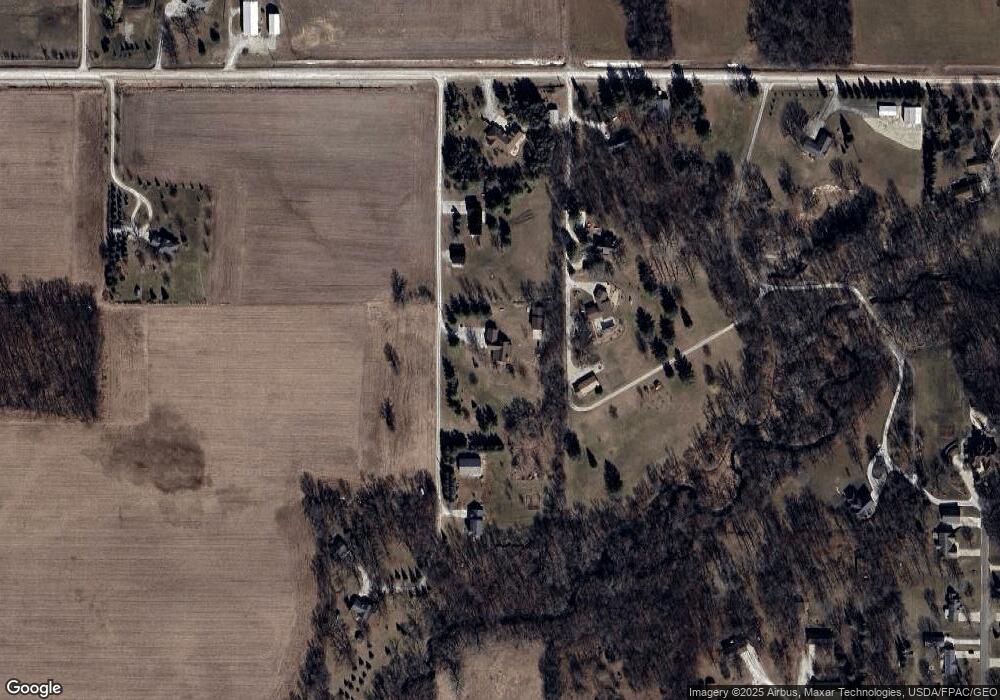
2092 215th St Independence, IA 50644
Estimated Value: $381,000 - $569,000
4
Beds
6
Baths
1,820
Sq Ft
$246/Sq Ft
Est. Value
About This Home
This home is located at 2092 215th St, Independence, IA 50644 and is currently estimated at $448,172, approximately $246 per square foot. 2092 215th St is a home located in Buchanan County with nearby schools including West Elementary School, East Elementary School, and Independence Junior/Senior High School.
Ownership History
Date
Name
Owned For
Owner Type
Purchase Details
Closed on
May 7, 2008
Sold by
Wubben Douglas and Wubben Christa
Bought by
Kleve Scott J and Kleve Karla J
Current Estimated Value
Home Financials for this Owner
Home Financials are based on the most recent Mortgage that was taken out on this home.
Original Mortgage
$252,000
Outstanding Balance
$159,507
Interest Rate
5.87%
Mortgage Type
New Conventional
Estimated Equity
$288,665
Create a Home Valuation Report for This Property
The Home Valuation Report is an in-depth analysis detailing your home's value as well as a comparison with similar homes in the area
Home Values in the Area
Average Home Value in this Area
Purchase History
| Date | Buyer | Sale Price | Title Company |
|---|---|---|---|
| Kleve Scott J | $280,000 | None Available |
Source: Public Records
Mortgage History
| Date | Status | Borrower | Loan Amount |
|---|---|---|---|
| Open | Kleve Scott J | $252,000 |
Source: Public Records
Tax History Compared to Growth
Tax History
| Year | Tax Paid | Tax Assessment Tax Assessment Total Assessment is a certain percentage of the fair market value that is determined by local assessors to be the total taxable value of land and additions on the property. | Land | Improvement |
|---|---|---|---|---|
| 2025 | $4,360 | $400,450 | $61,000 | $339,450 |
| 2024 | $4,360 | $361,300 | $51,620 | $309,680 |
| 2023 | $4,228 | $361,300 | $51,620 | $309,680 |
| 2022 | $4,076 | $304,220 | $41,250 | $262,970 |
| 2021 | $4,132 | $304,220 | $41,250 | $262,970 |
| 2020 | $4,132 | $280,930 | $37,500 | $243,430 |
| 2019 | $4,300 | $280,930 | $37,500 | $243,430 |
| 2018 | $4,040 | $275,350 | $37,500 | $237,850 |
| 2017 | $3,780 | $275,350 | $37,500 | $237,850 |
| 2016 | $3,684 | $251,650 | $28,260 | $223,390 |
| 2015 | $3,684 | $251,650 | $28,260 | $223,390 |
| 2014 | $3,806 | $251,650 | $28,260 | $223,390 |
Source: Public Records
Map
Nearby Homes