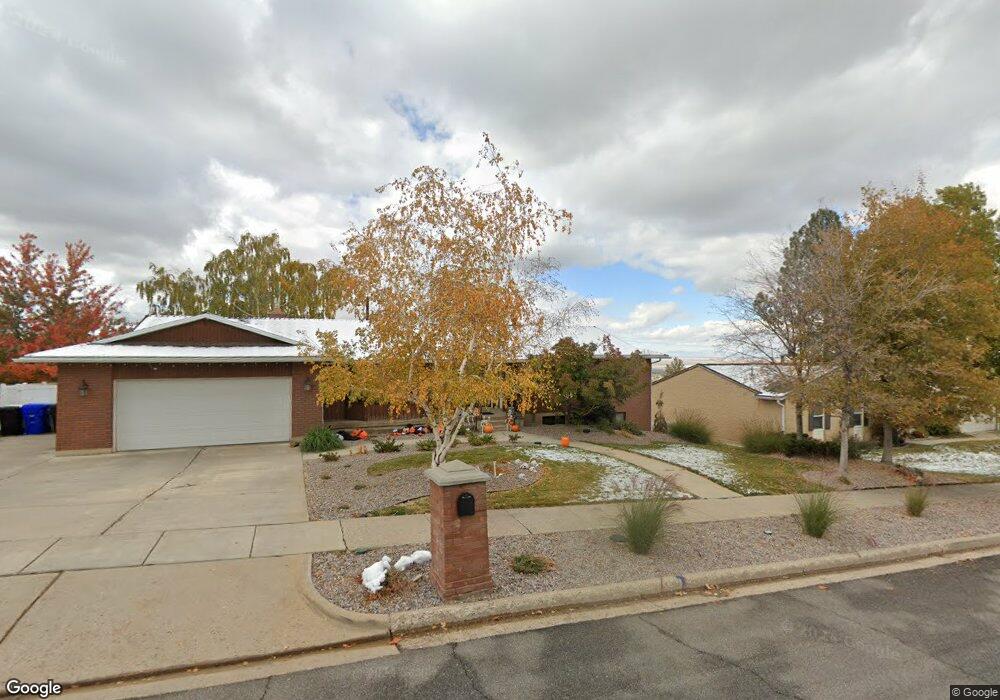
2092 S 1150 E Bountiful, UT 84010
Estimated Value: $578,000 - $660,000
4
Beds
3
Baths
1,575
Sq Ft
$401/Sq Ft
Est. Value
About This Home
This home is located at 2092 S 1150 E, Bountiful, UT 84010 and is currently estimated at $631,296, approximately $400 per square foot. 2092 S 1150 E is a home located in Davis County with nearby schools including Muir School, Mueller Park Junior High School, and Bountiful High School.
Ownership History
Date
Name
Owned For
Owner Type
Purchase Details
Closed on
Mar 19, 1996
Sold by
Hogan Celeste G and Hyatt Kelvin L
Bought by
Hyatt Kelvin L
Current Estimated Value
Home Financials for this Owner
Home Financials are based on the most recent Mortgage that was taken out on this home.
Original Mortgage
$117,000
Outstanding Balance
$3,844
Interest Rate
7.05%
Estimated Equity
$627,452
Purchase Details
Closed on
Feb 8, 1996
Sold by
Hyatt Susan G and Hogan Celeste G
Bought by
Hogan Celeste G and Hyatt Kelvin L
Home Financials for this Owner
Home Financials are based on the most recent Mortgage that was taken out on this home.
Original Mortgage
$117,000
Outstanding Balance
$3,844
Interest Rate
7.05%
Estimated Equity
$627,452
Purchase Details
Closed on
Jan 11, 1996
Sold by
Hyatt Susan G
Bought by
Hyatt Kelvin L
Create a Home Valuation Report for This Property
The Home Valuation Report is an in-depth analysis detailing your home's value as well as a comparison with similar homes in the area
Purchase History
| Date | Buyer | Sale Price | Title Company |
|---|---|---|---|
| Hyatt Kelvin L | -- | Associated Title Company | |
| Hogan Celeste G | -- | Associated Title Company | |
| Hyatt Kelvin L | -- | Associated Title Company |
Source: Public Records
Mortgage History
| Date | Status | Borrower | Loan Amount |
|---|---|---|---|
| Open | Hyatt Kelvin L | $117,000 |
Source: Public Records
Tax History
| Year | Tax Paid | Tax Assessment Tax Assessment Total Assessment is a certain percentage of the fair market value that is determined by local assessors to be the total taxable value of land and additions on the property. | Land | Improvement |
|---|---|---|---|---|
| 2025 | $3,716 | $342,100 | $137,931 | $204,169 |
| 2024 | $3,486 | $331,650 | $127,213 | $204,437 |
| 2023 | $3,466 | $599,000 | $230,131 | $368,869 |
| 2022 | $3,439 | $325,600 | $122,469 | $203,131 |
| 2021 | $3,081 | $446,000 | $181,979 | $264,021 |
| 2020 | $2,699 | $392,000 | $165,714 | $226,286 |
| 2019 | $2,727 | $387,000 | $164,418 | $222,582 |
| 2018 | $2,502 | $349,000 | $145,308 | $203,692 |
| 2016 | $2,244 | $169,895 | $45,948 | $123,947 |
| 2015 | $2,212 | $158,235 | $45,948 | $112,287 |
| 2014 | $2,037 | $149,162 | $45,948 | $103,214 |
| 2013 | -- | $144,783 | $45,815 | $98,968 |
Source: Public Records
Map
Nearby Homes
- 2136 Elaine Dr
- 1087 Arlington Way
- 842 E 2150 S
- 0 Bountiful Blvd
- 1997 S 800 E
- 1475 Mueller Park Rd
- 1987 Mapleview Dr
- 1785 1450 E Unit 604
- 771 E 1825 S
- 1820 S High Pointe Dr
- 626 E 2150 S
- 1735 S Temple Ct Unit 203
- 1596 E Millbrook Way
- 631 E 1700 S
- 1886 S Jeri Dr
- 795 Abby Ln Unit 5
- 438 E 1800 S
- 2059 S 350 E Unit 6
- 861 E Millbrook Way
- 2046 S 350 E Unit 4
Your Personal Tour Guide
Ask me questions while you tour the home.