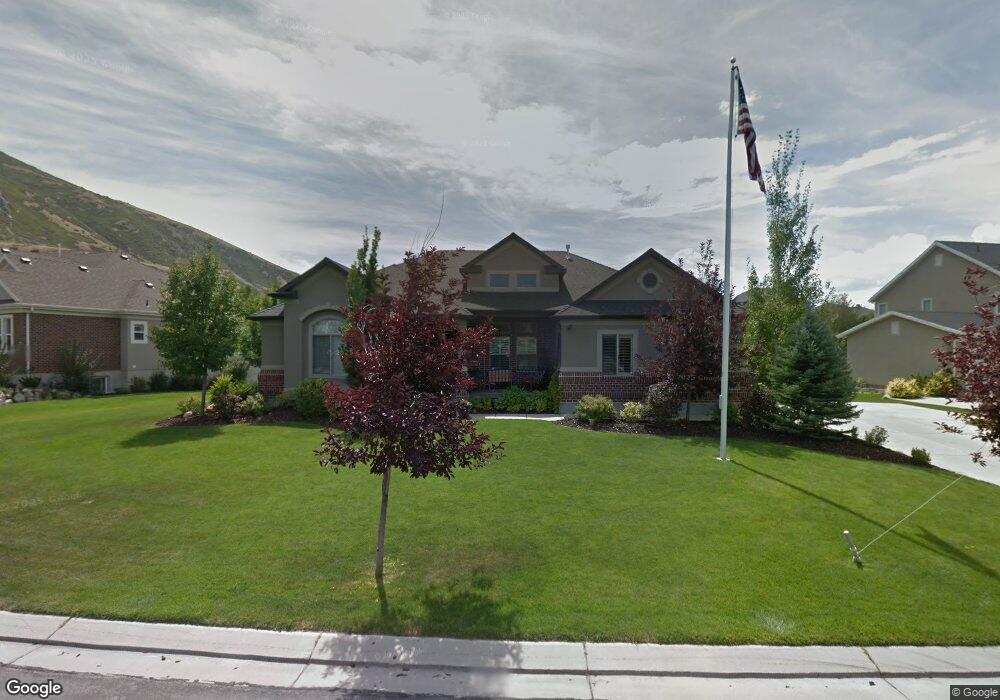
2092 Tuscany Creek Way Draper, UT 84020
Estimated Value: $1,297,363 - $1,459,000
3
Beds
2
Baths
4,864
Sq Ft
$283/Sq Ft
Est. Value
About This Home
This home is located at 2092 Tuscany Creek Way, Draper, UT 84020 and is currently estimated at $1,375,341, approximately $282 per square foot. 2092 Tuscany Creek Way is a home located in Salt Lake County with nearby schools including Draper Park Middle School, Corner Canyon High School, and Summit Academy - Draper Elementary Campus.
Ownership History
Date
Name
Owned For
Owner Type
Purchase Details
Closed on
Oct 26, 2021
Sold by
Swiler Bill E
Bought by
Swiler Bill E and Swiler Margaret
Current Estimated Value
Home Financials for this Owner
Home Financials are based on the most recent Mortgage that was taken out on this home.
Original Mortgage
$338,940
Outstanding Balance
$310,102
Interest Rate
2.88%
Mortgage Type
VA
Estimated Equity
$1,065,239
Purchase Details
Closed on
Jan 21, 2010
Sold by
Ivory Homes Ltd
Bought by
Swiler Bill E
Home Financials for this Owner
Home Financials are based on the most recent Mortgage that was taken out on this home.
Original Mortgage
$520,581
Interest Rate
4.78%
Mortgage Type
VA
Purchase Details
Closed on
Jan 14, 2010
Sold by
Ivory Development Llc
Bought by
Ivory Homes Ltd
Home Financials for this Owner
Home Financials are based on the most recent Mortgage that was taken out on this home.
Original Mortgage
$520,581
Interest Rate
4.78%
Mortgage Type
VA
Create a Home Valuation Report for This Property
The Home Valuation Report is an in-depth analysis detailing your home's value as well as a comparison with similar homes in the area
Home Values in the Area
Average Home Value in this Area
Purchase History
| Date | Buyer | Sale Price | Title Company |
|---|---|---|---|
| Swiler Bill E | -- | Lsi Title Co | |
| Swiler Bill E | -- | Cottonwood Title | |
| Ivory Homes Ltd | -- | Cottonwood Title |
Source: Public Records
Mortgage History
| Date | Status | Borrower | Loan Amount |
|---|---|---|---|
| Open | Swiler Bill E | $338,940 | |
| Closed | Swiler Bill E | $520,581 |
Source: Public Records
Tax History Compared to Growth
Tax History
| Year | Tax Paid | Tax Assessment Tax Assessment Total Assessment is a certain percentage of the fair market value that is determined by local assessors to be the total taxable value of land and additions on the property. | Land | Improvement |
|---|---|---|---|---|
| 2025 | $5,534 | $1,125,200 | $341,100 | $784,100 |
| 2024 | $5,534 | $1,057,100 | $334,400 | $722,700 |
| 2023 | $4,950 | $938,600 | $318,200 | $620,400 |
| 2022 | $5,129 | $939,400 | $312,000 | $627,400 |
| 2021 | $4,776 | $747,300 | $260,000 | $487,300 |
| 2020 | $4,583 | $679,700 | $253,800 | $425,900 |
| 2019 | $4,732 | $685,700 | $249,200 | $436,500 |
| 2018 | $4,782 | $708,200 | $249,200 | $459,000 |
| 2017 | $5,077 | $720,400 | $249,200 | $471,200 |
| 2016 | $4,570 | $630,100 | $249,200 | $380,900 |
| 2015 | $4,055 | $517,700 | $215,700 | $302,000 |
| 2014 | $3,904 | $487,000 | $204,100 | $282,900 |
Source: Public Records
Map
Nearby Homes
- 2026 E Tivoli Hills Ct
- 2019 E Graystone Ct
- 12182 S Pine Valley Way
- 2412 Bear Hill Dr S
- 1937 Wasatch Blvd
- 1644 Pebble Beach Cir
- 11778 S 1700 E
- 12838 Hickory Ridge Ln
- 1612 E Hidden Valley Rd
- 1481 Noelle Rd
- 2234 E Willow Brook Way
- 12882 S Ellerbeck Ln Unit 12882
- 15 Lone Hollow Dr
- 11966 Bluff View Dr
- 11922 S Bluff View Dr
- 11551 S Woodhampton Dr Unit 2
- 11551 S Woodhampton Dr
- 11545 S Hagan Rd
- 98 E Lone Hollow Dr S Unit 902
- 35 E Lone Hollow Dr
- 2094 E Tuscany Creek Way
- 2082 E Tuscany Creek Way
- 2082 E Tuscany Creek Way
- 12063 S Catania Dr
- 12063 S Catania Dr
- 2112 E Tuscany Creek Way
- 2075 Tivoli Hills Ct
- 2075 E Tivoli Hills Ct
- 2087 Tuscany Creek Way
- 2125 E Tuscany Creek Way
- 2125 Tuscany Creek Way
- 2085 Tivoli Hills Ct
- 2063 Tivoli Hills Ct
- 2063 E Tivoli Hills Ct
- 12053 Catania Dr
- 12046 Catania Dr
- 12046 S Catania Dr
- 2122 E Tuscany Creek Way
- 12072 S Milona Dr
- 2051 E Tivoli Hills Ct