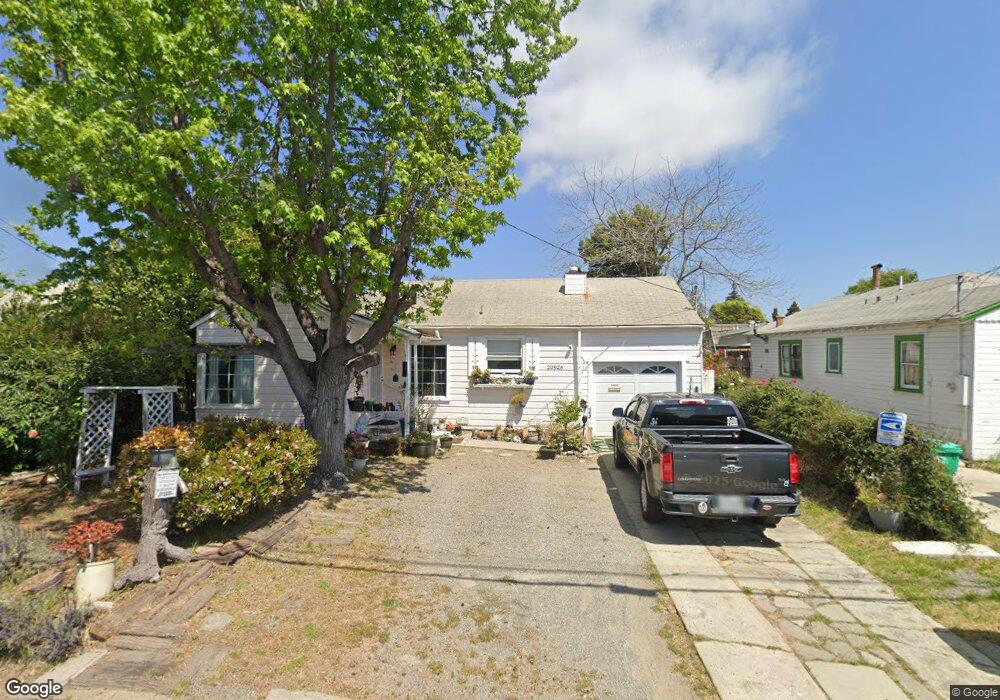
20926 Haviland Ave Hayward, CA 94541
Estimated Value: $620,000 - $760,000
2
Beds
1
Bath
1,184
Sq Ft
$584/Sq Ft
Est. Value
About This Home
This home is located at 20926 Haviland Ave, Hayward, CA 94541 and is currently estimated at $691,335, approximately $583 per square foot. 20926 Haviland Ave is a home located in Alameda County with nearby schools including Winton Middle School, Hayward High School, and St. John Catholic School.
Ownership History
Date
Name
Owned For
Owner Type
Purchase Details
Closed on
Oct 14, 2015
Sold by
Gonsalves Jessica M and Gilliland Jessica Marie
Bought by
Gonsalves Jessica M and Gonsalves Robert J
Current Estimated Value
Home Financials for this Owner
Home Financials are based on the most recent Mortgage that was taken out on this home.
Original Mortgage
$323,250
Outstanding Balance
$254,244
Interest Rate
3.87%
Mortgage Type
New Conventional
Estimated Equity
$437,091
Purchase Details
Closed on
Jul 24, 2013
Sold by
Skarphol Randy and The Skarphol Family Trust
Bought by
Gilliland Jessica Marie
Home Financials for this Owner
Home Financials are based on the most recent Mortgage that was taken out on this home.
Original Mortgage
$304,385
Interest Rate
5.5%
Mortgage Type
FHA
Purchase Details
Closed on
Apr 2, 1996
Sold by
Skarphol Erwin B and Skarphol Jane E
Bought by
Skarphol Erwin B and Skarphol Jane E
Create a Home Valuation Report for This Property
The Home Valuation Report is an in-depth analysis detailing your home's value as well as a comparison with similar homes in the area
Home Values in the Area
Average Home Value in this Area
Purchase History
| Date | Buyer | Sale Price | Title Company |
|---|---|---|---|
| Gonsalves Jessica M | -- | Old Republic Title Company | |
| Gilliland Jessica Marie | $310,000 | Old Republic Title Company | |
| Skarphol Erwin B | -- | -- |
Source: Public Records
Mortgage History
| Date | Status | Borrower | Loan Amount |
|---|---|---|---|
| Open | Gonsalves Jessica M | $323,250 | |
| Closed | Gilliland Jessica Marie | $304,385 |
Source: Public Records
Tax History Compared to Growth
Tax History
| Year | Tax Paid | Tax Assessment Tax Assessment Total Assessment is a certain percentage of the fair market value that is determined by local assessors to be the total taxable value of land and additions on the property. | Land | Improvement |
|---|---|---|---|---|
| 2025 | $5,228 | $380,000 | $114,000 | $266,000 |
| 2024 | $5,228 | $372,551 | $111,765 | $260,786 |
| 2023 | $5,181 | $365,247 | $109,574 | $255,673 |
| 2022 | $5,059 | $358,087 | $107,426 | $250,661 |
| 2021 | $4,991 | $351,068 | $105,320 | $245,748 |
| 2020 | $4,907 | $347,468 | $104,240 | $243,228 |
| 2019 | $4,921 | $340,658 | $102,197 | $238,461 |
| 2018 | $4,627 | $333,981 | $100,194 | $233,787 |
| 2017 | $4,512 | $327,434 | $98,230 | $229,204 |
| 2016 | $4,248 | $321,014 | $96,304 | $224,710 |
| 2015 | $4,156 | $316,193 | $94,858 | $221,335 |
| 2014 | $3,959 | $310,000 | $93,000 | $217,000 |
Source: Public Records
Map
Nearby Homes
- 20923 Haviland Ave
- 550 Blossom Way
- 436 Grove Way
- 263 Medford Ave
- 19641 Medford Cir Unit 5
- 641 Jordan Way
- 823 Blossom Way
- 19884 Meekland Ave
- 21564 Meekland Ave Unit 1
- 347 Willow Ave Unit 6
- 19539 Meekland Ave
- 18905 Standish Ave
- 19736 Times Ave
- 21806 Meekland Ave
- 188 Sunset Blvd
- 19837 Waverly Ave
- 492 Sunset Blvd
- 680 Sunset Blvd
- 188 Laurel Ave
- 357 Laurel Ave Unit 4
- 20864 Haviland Ave
- 20950 Haviland Ave
- 20832 Haviland Ave
- 20976 Haviland Ave
- 20762 Haviland Ave
- 476 Blossom Way
- 20863 Haviland Ave
- 20831 Haviland Ave
- 20730 Haviland Ave
- 389 Saint George St
- 20660 Haviland Ave
- 385 Saint George St
- 514 Blossom Way
- 21105 Santos St
- 367 Saint George St
- 20628 Haviland Ave
- 390 Saint George St
- 390 Blossom Way
- 523 Cherry Way
- 20627 Haviland Ave