--
Bed
4
Baths
16,464
Sq Ft
1.61
Acres
About This Home
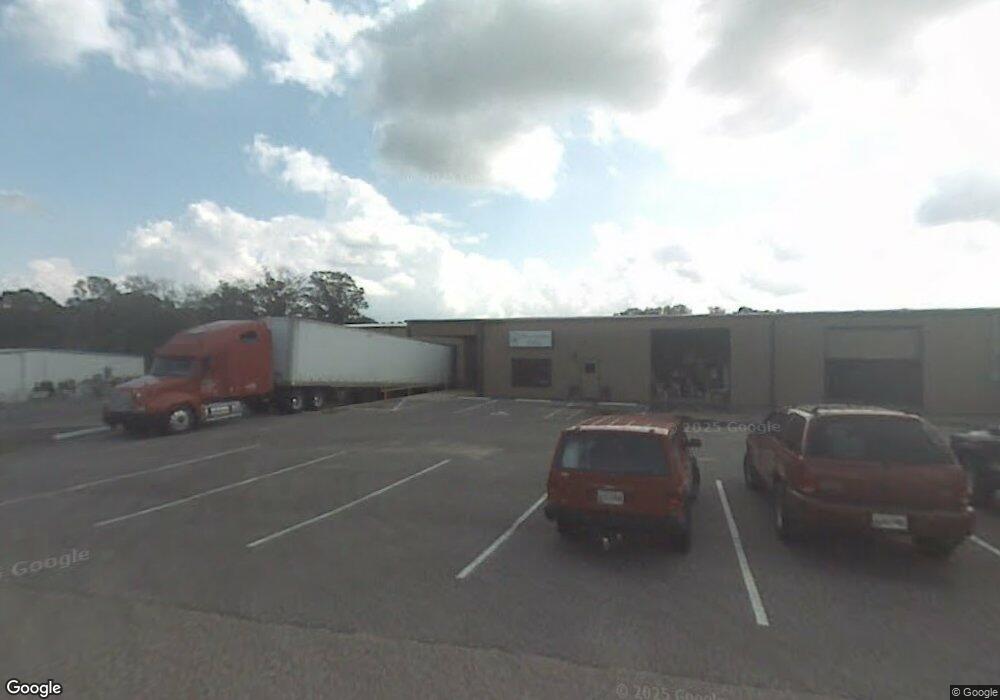
This home is located at 2094 Tipton Rd, Atoka, TN 38004. 2094 Tipton Rd is a home located in Tipton County with nearby schools including Atoka Elementary School, Munford Middle School, and Munford High School.
Ownership History
Date
Name
Owned For
Owner Type
Purchase Details
Closed on
May 27, 2016
Sold by
Community Bank
Bought by
Finishing Innovations Llc
Home Financials for this Owner
Home Financials are based on the most recent Mortgage that was taken out on this home.
Original Mortgage
$495,000
Outstanding Balance
$43,719
Interest Rate
3.66%
Mortgage Type
Commercial
Purchase Details
Closed on
Feb 11, 2013
Sold by
Southern Custom Home Build
Bought by
Community Bank
Purchase Details
Closed on
Aug 31, 2005
Sold by
Argo Distribution Llc
Bought by
Southern Custom Home Builders
Purchase Details
Closed on
Nov 1, 1999
Sold by
Terra International Inc
Bought by
Agro Dist
Purchase Details
Closed on
Jun 30, 1999
Bought by
Agro Distribution Llc
Purchase Details
Closed on
Jan 17, 1991
Bought by
Terra International Inc
Purchase Details
Closed on
Feb 21, 1990
Bought by
Chaney Eddie and Chaney Ann
Purchase Details
Closed on
Aug 24, 1989
Bought by
Munford Development Co
Create a Home Valuation Report for This Property
The Home Valuation Report is an in-depth analysis detailing your home's value as well as a comparison with similar homes in the area
Home Values in the Area
Average Home Value in this Area
Purchase History
| Date | Buyer | Sale Price | Title Company |
|---|---|---|---|
| Finishing Innovations Llc | -- | -- | |
| Finishing Innovation Llc | $458,797 | -- | |
| Community Bank | $553,000 | -- | |
| Southern Custom Home Builders | $240,000 | -- | |
| Agro Dist | $200,000 | -- | |
| Agro Distribution Llc | $200,000 | -- | |
| Terra International Inc | $85,000 | -- | |
| Chaney Eddie | $15,000 | -- | |
| Munford Development Co | -- | -- |
Source: Public Records
Mortgage History
| Date | Status | Borrower | Loan Amount |
|---|---|---|---|
| Open | Finishing Innovation Llc | $495,000 |
Source: Public Records
Tax History Compared to Growth
Tax History
| Year | Tax Paid | Tax Assessment Tax Assessment Total Assessment is a certain percentage of the fair market value that is determined by local assessors to be the total taxable value of land and additions on the property. | Land | Improvement |
|---|---|---|---|---|
| 2024 | $6,297 | $279,160 | $31,560 | $247,600 |
| 2023 | $6,297 | $279,160 | $31,560 | $247,600 |
| 2022 | $8,062 | $262,600 | $31,560 | $231,040 |
| 2021 | $7,931 | $262,600 | $31,560 | $231,040 |
| 2020 | $7,925 | $262,600 | $31,560 | $231,040 |
| 2019 | $9,113 | $253,840 | $31,560 | $222,280 |
| 2018 | $9,113 | $253,840 | $31,560 | $222,280 |
| 2017 | $8,174 | $253,840 | $31,560 | $222,280 |
| 2016 | $8,174 | $253,840 | $31,560 | $222,280 |
| 2015 | $8,166 | $253,840 | $31,560 | $222,280 |
| 2014 | $7,543 | $253,825 | $0 | $0 |
Source: Public Records
Map
Nearby Homes
- 13724 51 S Highway Hwy
- 01 Cobb Ave
- 02 Cobb Ave
- 03 Cobb Ave
- 95 Wallace Cove
- 18 Fox Trot Ln
- 0 Meade Lake Rd Unit 10196514
- 27 Rose Bush St
- 39 Rose Bush St
- 99 Margaret Place
- Beckett Plan at The Villages of Green Meadows
- Bennett Plan at The Villages of Green Meadows
- Cooper Plan at The Villages of Green Meadows
- Carver Plan at The Villages of Green Meadows
- Miller Plan at The Villages of Green Meadows
- Spencer Plan at The Villages of Green Meadows
- Nelson Plan at The Villages of Green Meadows
- Isabel Plan at The Villages of Green Meadows
- Aspen Plan at The Villages of Green Meadows
- Carson Plan at The Villages of Green Meadows
- 96 Atoka McLaughlin Dr
- 43 Atoka McLaughlin Dr
- 2025 Tipton Rd
- 13724 Highway 51 S
- 2304 Tipton Rd
- 13942 Highway 51 S
- 13779 Hwy 51 Hwy S
- 2321 Tipton Rd
- 2356 Tipton Rd
- 307 Joyce Ave
- 335 Joyce Ave
- 64 Watson Rd
- 363 Joyce Ave
- 1871 Tipton Rd
- 279 Joyce Ave
- 391 Joyce Ave
- 13528 Highway 51 S
- 251 Joyce Ave
- 84 Watson Rd
- 106 Watson Rd