20942 Pacific Coast Hwy Malibu, CA 90265
Estimated payment $17,812/month
About This Lot
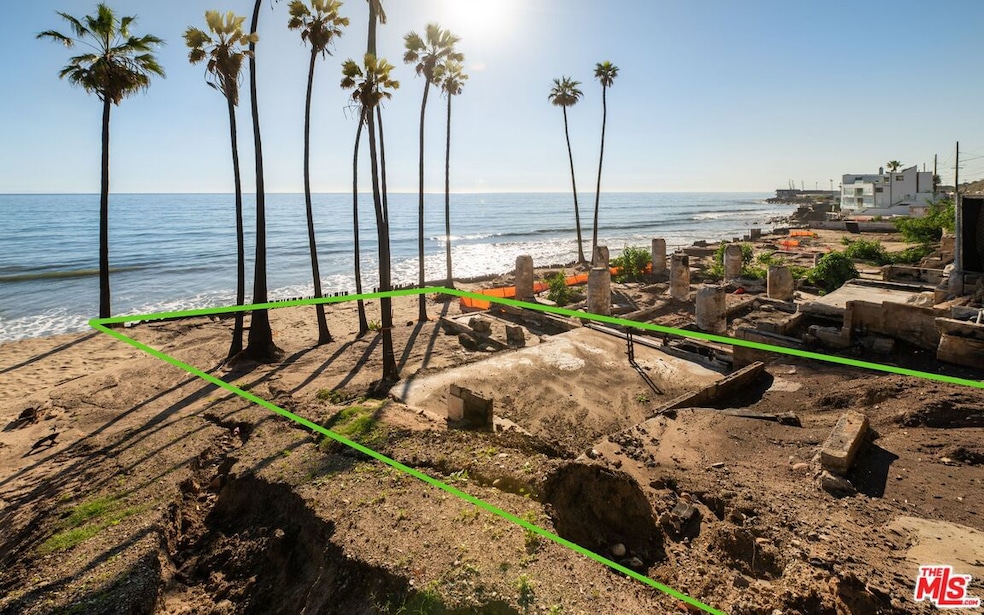
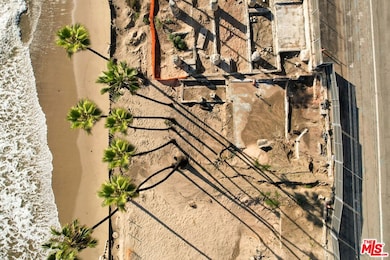
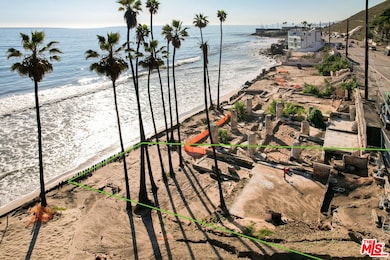
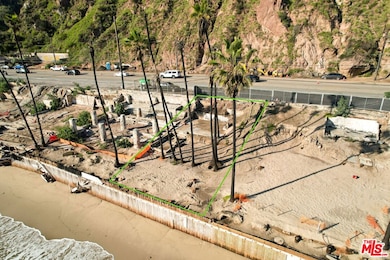
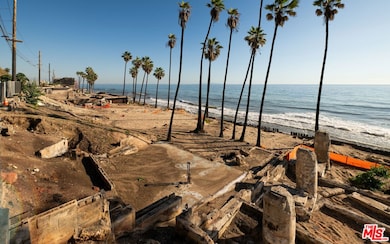
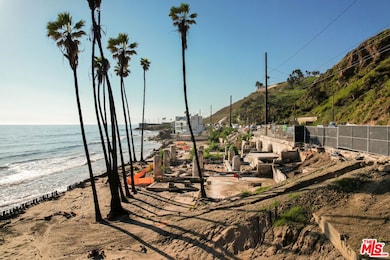
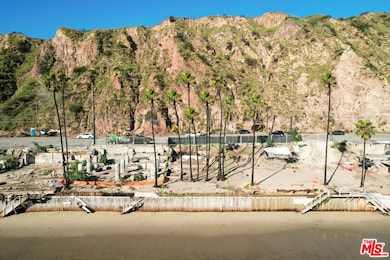
Located on the exclusive Las Flores beach right next to Nobu Malibu, SoHo House, Cross Creek, and 10 minutes from Santa Monica. This is the absolute best location if you're looking to build your ultimate beach home steps off the beach. Access to a private surf break. An oversized lot with 38 feet of coveted beach frontage for the ultimate Malibu beach lifestyle.
Property Details
Property Type
- Land
Est. Annual Taxes
- $56,100
Lot Details
- 8,371 Sq Ft Lot
- Lot Dimensions are 43x202
- Property is zoned MA-SF-M*
Property Views
- White Water Ocean Views
Utilities
- Phone Available
- Cable TV Available
Listing and Financial Details
- Assessor Parcel Number 4450-009-016
Map
Home Values in the Area
Average Home Value in this Area
Tax History
| Year | Tax Paid | Tax Assessment Tax Assessment Total Assessment is a certain percentage of the fair market value that is determined by local assessors to be the total taxable value of land and additions on the property. | Land | Improvement |
|---|---|---|---|---|
| 2025 | $56,100 | $3,114,250 | $3,114,250 | -- |
| 2024 | $56,100 | $4,806,572 | $4,697,209 | $109,363 |
| 2023 | $55,099 | $4,712,326 | $4,605,107 | $107,219 |
| 2022 | $54,432 | $4,619,928 | $4,514,811 | $105,117 |
| 2021 | $53,210 | $4,529,342 | $4,426,286 | $103,056 |
| 2020 | $52,912 | $4,482,900 | $4,380,900 | $102,000 |
| 2019 | $52,182 | $4,395,000 | $4,295,000 | $100,000 |
| 2018 | $36,443 | $3,139,985 | $3,001,462 | $138,523 |
| 2017 | $36,287 | $3,078,417 | $2,942,610 | $135,807 |
| 2016 | $35,160 | $3,018,057 | $2,884,912 | $133,145 |
| 2015 | $34,654 | $2,972,724 | $2,841,578 | $131,146 |
| 2014 | $34,176 | $2,914,494 | $2,785,916 | $128,578 |
Property History
| Date | Event | Price | List to Sale | Price per Sq Ft | Prior Sale |
|---|---|---|---|---|---|
| 12/02/2025 12/02/25 | For Sale | $2,495,000 | -43.2% | -- | |
| 09/28/2018 09/28/18 | Sold | $4,395,000 | -2.3% | $4,386 / Sq Ft | View Prior Sale |
| 09/27/2018 09/27/18 | Pending | -- | -- | -- | |
| 08/14/2018 08/14/18 | Price Changed | $4,500,000 | -9.1% | $4,491 / Sq Ft | |
| 08/14/2018 08/14/18 | For Sale | $4,950,000 | +12.6% | $4,940 / Sq Ft | |
| 07/16/2018 07/16/18 | Off Market | $4,395,000 | -- | -- | |
| 05/11/2018 05/11/18 | Price Changed | $4,950,000 | -5.7% | $4,940 / Sq Ft | |
| 02/27/2018 02/27/18 | For Sale | $5,250,000 | -- | $5,240 / Sq Ft |
Purchase History
| Date | Type | Sale Price | Title Company |
|---|---|---|---|
| Grant Deed | $4,395,000 | Equity Title Company | |
| Quit Claim Deed | $70,000 | None Available | |
| Grant Deed | -- | Provident Title Company | |
| Grant Deed | -- | Fidelity National Title Co | |
| Interfamily Deed Transfer | -- | -- |
Mortgage History
| Date | Status | Loan Amount | Loan Type |
|---|---|---|---|
| Previous Owner | $2,700,000 | Purchase Money Mortgage |
Source: The MLS
MLS Number: 25622887
APN: 4450-009-016
Disclaimer: Certain information contained herein is derived from information provided by parties other than Homes.com. All information provided is deemed reliable, but is not guaranteed to be accurate and should be independently verified.
![]() © 2025 The MLS™ - Combined L.A. Westside MLS (CLAW). All rights reserved. Based on information from The MLS™ - Combined L.A. Westside MLS (CLAW). All data, including all measurements and calculations of area, is obtained from various sources and has not been, and will not be, verified by broker or MLS. All information should be independently reviewed and verified for accuracy. Properties may or may not be listed by the office/agent presenting the information.
© 2025 The MLS™ - Combined L.A. Westside MLS (CLAW). All rights reserved. Based on information from The MLS™ - Combined L.A. Westside MLS (CLAW). All data, including all measurements and calculations of area, is obtained from various sources and has not been, and will not be, verified by broker or MLS. All information should be independently reviewed and verified for accuracy. Properties may or may not be listed by the office/agent presenting the information.
IDX information is provided exclusively for personal, non-commercial use, and may not be used for any purpose other than to identify prospective properties consumers may be interested in purchasing.
Information is deemed reliable but not guaranteed.
- 21016 Pacific Coast Hwy
- 21030 Pacific Coast Hwy
- 21062 Pacific Coast Hwy
- 20840 Pacific Coast Hwy
- 20832 Pacific Coast Hwy
- 20802 Pacific Coast Hwy
- 20704 Eagle Pass Dr
- 20740 Las Flores Mesa Dr
- 20616 Pacific Coast Hwy
- 20610 Pacific Coast Hwy
- 20608 Pacific Coast Hwy
- 20604 Pacific Coast Hwy
- 3833 Rambla Pacifico
- 3851 Rambla Orienta
- 20795 Cool Oak Way
- 20538 Pacific Coast Hwy
- 20799 Cool Oak Way
- 21415 Rambla Vista
- 20786 Cool Oak Way
- 20460 Pacific Coast Hwy
- 3966 Las Flores Canyon Rd
- 3918 Las Flores Canyon Rd
- 20656 Pacific Coast Hwy
- 3908 A & B Las Flores Canyon Rd
- 20644 Pacific Coast Hwy
- 20638 Pacific Coast Hwy Unit 9
- 20638 Pacific Coast Hwy Unit 9-17
- 20755 Seaboard Rd
- 3859 Rambla Pacifico St
- 21349 Rambla Vista
- 3709 Las Flores Canyon Rd
- 3709 Las Flores Canyon Rd Unit B
- 3709 Las Flores Canyon Rd Unit A
- 20647 Seaboard Rd
- 3897 Rambla Orienta
- 20462 Pacific Coast Hwy
- 20456 Pacific Coast Hwy
- 3916 Rambla Orienta
- 20440 Pacific Coast Hwy
- 20537 Little Rock Way Unit A
