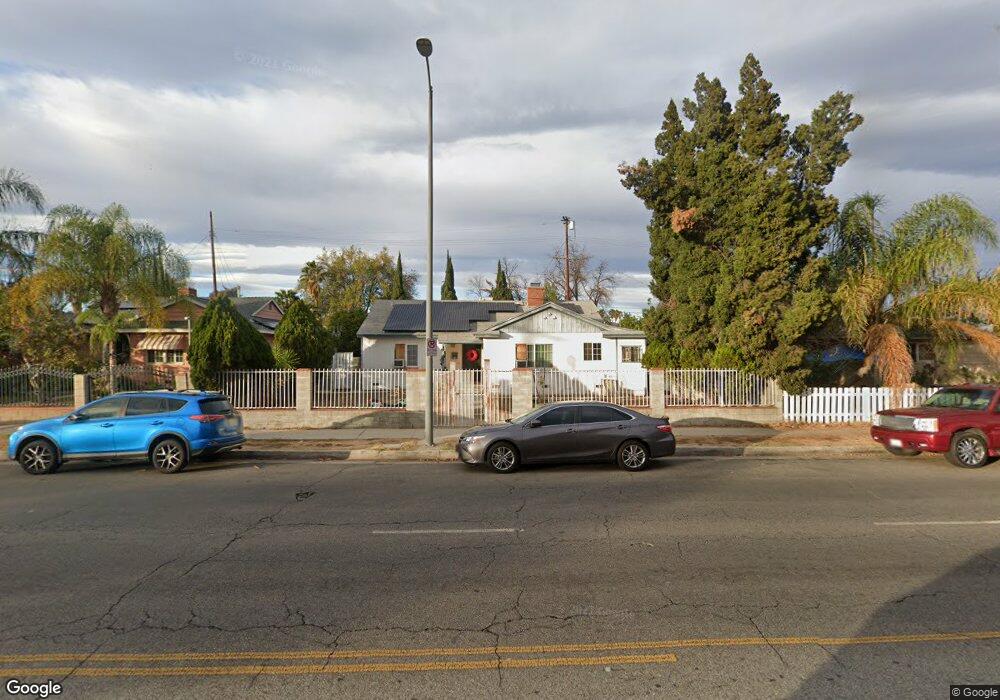
20943 Saticoy St Canoga Park, CA 91304
Canoga Park NeighborhoodEstimated Value: $736,000 - $801,000
3
Beds
2
Baths
1,428
Sq Ft
$532/Sq Ft
Est. Value
About This Home
This home is located at 20943 Saticoy St, Canoga Park, CA 91304 and is currently estimated at $759,148, approximately $531 per square foot. 20943 Saticoy St is a home located in Los Angeles County with nearby schools including Sunny Brae Avenue Elementary School, Christopher Columbus Middle School, and Canoga Park Senior High School.
Ownership History
Date
Name
Owned For
Owner Type
Purchase Details
Closed on
Sep 6, 2022
Sold by
Mejia Jose I and Mejia Edith Maria
Bought by
Jose Ines Mejia G Or Maria Edith Mejia Living
Current Estimated Value
Purchase Details
Closed on
Jan 7, 2002
Sold by
Sandoval Karleen T
Bought by
Sandoval Rafael
Home Financials for this Owner
Home Financials are based on the most recent Mortgage that was taken out on this home.
Original Mortgage
$158,400
Interest Rate
6.84%
Purchase Details
Closed on
Nov 9, 2001
Sold by
Sandoval Rafael
Bought by
Mejia Jose I
Home Financials for this Owner
Home Financials are based on the most recent Mortgage that was taken out on this home.
Original Mortgage
$158,400
Interest Rate
6.84%
Purchase Details
Closed on
Oct 23, 1996
Sold by
Demarco Trust
Bought by
Sandoval Rafael
Home Financials for this Owner
Home Financials are based on the most recent Mortgage that was taken out on this home.
Original Mortgage
$100,000
Interest Rate
10.85%
Create a Home Valuation Report for This Property
The Home Valuation Report is an in-depth analysis detailing your home's value as well as a comparison with similar homes in the area
Home Values in the Area
Average Home Value in this Area
Purchase History
| Date | Buyer | Sale Price | Title Company |
|---|---|---|---|
| Jose Ines Mejia G Or Maria Edith Mejia Living | -- | -- | |
| Sandoval Rafael | -- | -- | |
| Mejia Jose I | $198,000 | Equity Title Company | |
| Sandoval Rafael | $125,000 | First American Title Co |
Source: Public Records
Mortgage History
| Date | Status | Borrower | Loan Amount |
|---|---|---|---|
| Previous Owner | Mejia Jose I | $158,400 | |
| Previous Owner | Sandoval Rafael | $100,000 | |
| Closed | Sandoval Rafael | $18,750 | |
| Closed | Mejia Jose I | $39,600 |
Source: Public Records
Tax History Compared to Growth
Tax History
| Year | Tax Paid | Tax Assessment Tax Assessment Total Assessment is a certain percentage of the fair market value that is determined by local assessors to be the total taxable value of land and additions on the property. | Land | Improvement |
|---|---|---|---|---|
| 2025 | $3,825 | $292,481 | $210,356 | $82,125 |
| 2024 | $3,825 | $286,747 | $206,232 | $80,515 |
| 2023 | $3,756 | $281,126 | $202,189 | $78,937 |
| 2022 | $3,591 | $275,615 | $198,225 | $77,390 |
| 2021 | $3,544 | $270,212 | $194,339 | $75,873 |
| 2019 | $3,444 | $262,200 | $188,576 | $73,624 |
| 2018 | $3,315 | $257,060 | $184,879 | $72,181 |
| 2016 | $3,160 | $247,079 | $177,700 | $69,379 |
| 2015 | $3,116 | $243,368 | $175,031 | $68,337 |
| 2014 | $3,134 | $238,602 | $171,603 | $66,999 |
Source: Public Records
Map
Nearby Homes
- 21018 Lull St
- 7506 Independence Ave
- 7741 Variel Ave
- 7447 Loma Verde Ave
- 20722 Keswick St
- 7801 Kelvin Ave
- 20854 Runnymede St
- 20646 Hatton St
- 7800 Fairchild Ave
- 7830 Fairchild Ave
- 7812 Fairchild Ave
- 7327 Loma Verde Ave
- 20828 Blythe St
- 7356 Eton Ave
- 20551 Saticoy St
- 8021 Mcnulty Ave
- 7233 Loma Verde Ave
- 21032 Baltar St
- 7230 Kelvin Ave Unit 6
- 7463 Mason Ave
- 20937 Saticoy St
- 20949 Saticoy St
- 20931 Saticoy St
- 20955 Saticoy St
- 20940 Lull St
- 20934 Lull St
- 20946 Lull St
- 20925 Saticoy St
- 20952 Lull St
- 20928 Lull St
- 7558 Independence Ave
- 20946 Saticoy St
- 20950 Saticoy St
- 20940 Saticoy St
- 20919 Saticoy St
- 21001 Saticoy St
- 20936 Saticoy St
- 7550 Independence Ave
- 7626 Loma Verde Ave
- 20930 Saticoy St