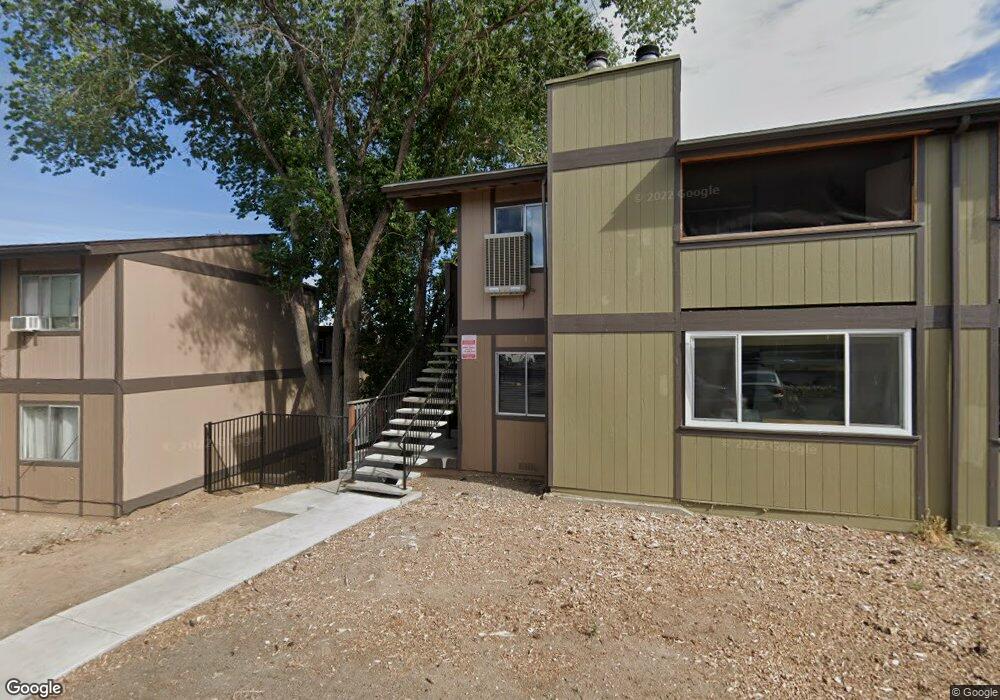
2095 Highview Ct Unit A4L Reno, NV 89512
Northeast Reno NeighborhoodEstimated Value: $174,000 - $183,000
2
Beds
2
Baths
919
Sq Ft
$194/Sq Ft
Est. Value
About This Home
This home is located at 2095 Highview Ct Unit A4L, Reno, NV 89512 and is currently estimated at $178,700, approximately $194 per square foot. 2095 Highview Ct Unit A4L is a home located in Washoe County with nearby schools including Rita Cannan Elementary School, Fred W. Traner Middle School, and Procter R. Hug High School.
Ownership History
Date
Name
Owned For
Owner Type
Purchase Details
Closed on
Nov 18, 2019
Sold by
Gordon W Diane
Bought by
Holden Herbert and Duque Galvez Maria
Current Estimated Value
Purchase Details
Closed on
Nov 13, 2018
Sold by
Gordon W Diane and Gordon Willie Diane
Bought by
Gordon W Diane and Gordon Trust
Purchase Details
Closed on
Aug 10, 2018
Sold by
Gordon Willie Diane and Gordon Amos
Bought by
Gordon Willie Diane
Purchase Details
Closed on
Dec 13, 2006
Sold by
Gordon Erich
Bought by
Gordon Willie Diane
Purchase Details
Closed on
Mar 22, 2004
Sold by
Gordon Willie Diane
Bought by
Gordon Amos
Purchase Details
Closed on
Jul 22, 2002
Sold by
Atlantic Mortgage & Investment Corp
Bought by
Hud
Purchase Details
Closed on
Jun 12, 2002
Sold by
Case Robert Gordon and Case Charlene Rebecca
Bought by
Atlantic Mtg & Investment Corp
Create a Home Valuation Report for This Property
The Home Valuation Report is an in-depth analysis detailing your home's value as well as a comparison with similar homes in the area
Home Values in the Area
Average Home Value in this Area
Purchase History
| Date | Buyer | Sale Price | Title Company |
|---|---|---|---|
| Holden Herbert | $118,500 | First American Title Reno | |
| Gordon W Diane | -- | None Available | |
| Gordon Willie Diane | -- | None Available | |
| Gordon Willie Diane | -- | None Available | |
| Gordon Amos | -- | First American Title | |
| Hud | -- | First American Title | |
| Atlantic Mtg & Investment Corp | $35,734 | First American Title |
Source: Public Records
Tax History Compared to Growth
Tax History
| Year | Tax Paid | Tax Assessment Tax Assessment Total Assessment is a certain percentage of the fair market value that is determined by local assessors to be the total taxable value of land and additions on the property. | Land | Improvement |
|---|---|---|---|---|
| 2026 | -- | $30,690 | $14,700 | $15,990 |
| 2025 | $226 | $31,023 | $14,700 | $16,323 |
| 2024 | $226 | $31,858 | $14,700 | $17,158 |
| 2023 | $220 | $29,664 | $14,245 | $15,419 |
| 2022 | $225 | $23,622 | $10,185 | $13,437 |
| 2021 | $215 | $21,016 | $7,385 | $13,631 |
| 2020 | $201 | $20,838 | $6,930 | $13,908 |
| 2019 | $192 | $21,054 | $7,420 | $13,634 |
| 2018 | $183 | $16,222 | $2,765 | $13,457 |
| 2017 | $181 | $16,932 | $3,430 | $13,502 |
| 2016 | $176 | $12,079 | $2,310 | $9,769 |
| 2015 | $54 | $7,982 | $1,610 | $6,372 |
| 2014 | $184 | $7,599 | $1,400 | $6,199 |
| 2013 | -- | $4,214 | $770 | $3,444 |
Source: Public Records
Map
Nearby Homes
- 2065 Wedekind Rd
- 2085 Highview Ct Unit 2
- 2085 Highview Ct Unit 1
- 2355 Tripp Dr Unit 7
- 2101 Highview Ct Unit 9
- 2520 Tripp Dr Unit A1L
- 1955 Wilder St
- 2555 Clear Acre Ln Unit 29-2
- 2555 Clear Acre Ln Unit 16-1
- 2555 Clear Acre Ln Unit 32
- 2555 Clear Acre Ln Unit 9-3
- 2555 Clear Acre Ln Unit 93-3
- 2650 Daffodil Way
- 2090 Fife Dr
- 2735 Daffodil Way
- 1405 Selmi Dr Unit 44
- 2140 Barberry Way
- 2135 Barberry Way
- 1990 Trainer Way
- 2301 Oddie Blvd Unit 56
- 2095 Highview Ct Unit 8
- 2095 Highview Ct Unit 7
- 2095 Highview Ct Unit 1
- 2095 Highview Ct
- 2095 Highview Ct Unit B5L
- 2095 Highview Ct
- 2095 Highview Ct Unit A1L
- 2095 Highview Ct Unit 12
- 2095 Highview Ct Unit A4U
- 2095 Highview Ct Unit B6U
- 2095 Highview Ct Unit B5U
- 2095 Highview Ct Unit A1U
- 2095 Highview Ct Unit A2L
- 2095 Highview Ct Unit 4
- 2095 Highview Ct Unit 11
- 2095 Highview Ct Unit 2
- 2095 Highview Ct Unit 9
- 2095 Highview Ct Unit 5
- 2095 Highview Ct Unit 10
- 2095 Highview Court #7 Unit 7