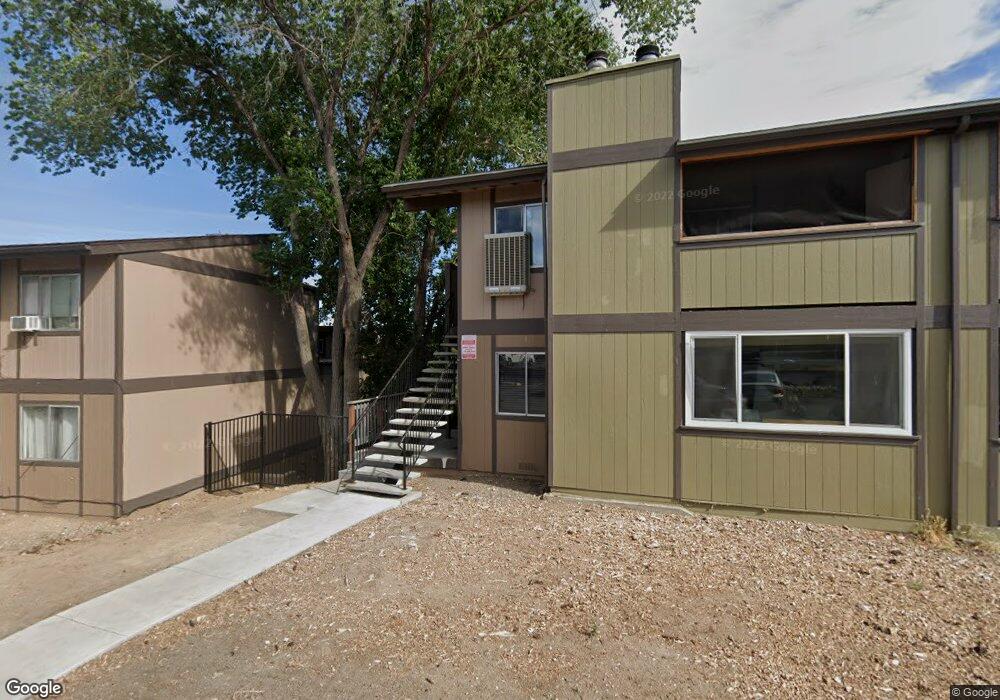
2095 Highview Ct Unit B6U Reno, NV 89512
Northeast Reno NeighborhoodEstimated Value: $192,000 - $265,000
3
Beds
2
Baths
1,165
Sq Ft
$194/Sq Ft
Est. Value
About This Home
This home is located at 2095 Highview Ct Unit B6U, Reno, NV 89512 and is currently estimated at $225,502, approximately $193 per square foot. 2095 Highview Ct Unit B6U is a home located in Washoe County with nearby schools including Rita Cannan Elementary School, Fred W. Traner Middle School, and Procter R. Hug High School.
Ownership History
Date
Name
Owned For
Owner Type
Purchase Details
Closed on
Jul 22, 2025
Sold by
Page Paul M
Bought by
Paul Page Trust
Current Estimated Value
Purchase Details
Closed on
Nov 3, 2011
Sold by
Deutsche Bank National Trust Company
Bought by
Page Paul M
Purchase Details
Closed on
Jun 8, 2011
Sold by
Webster James B
Bought by
Deutsche Bank National Trust Company
Purchase Details
Closed on
Jul 17, 2001
Sold by
Green Roger W and Limroth Sharon L
Bought by
Webster James B
Home Financials for this Owner
Home Financials are based on the most recent Mortgage that was taken out on this home.
Original Mortgage
$45,600
Interest Rate
7.15%
Create a Home Valuation Report for This Property
The Home Valuation Report is an in-depth analysis detailing your home's value as well as a comparison with similar homes in the area
Home Values in the Area
Average Home Value in this Area
Purchase History
| Date | Buyer | Sale Price | Title Company |
|---|---|---|---|
| Paul Page Trust | -- | None Listed On Document | |
| Page Paul M | $18,000 | First American Title Reno | |
| Deutsche Bank National Trust Company | $21,600 | Pasion Title Services | |
| Webster James B | $48,000 | Stewart Title Northern Nevad |
Source: Public Records
Mortgage History
| Date | Status | Borrower | Loan Amount |
|---|---|---|---|
| Previous Owner | Webster James B | $45,600 |
Source: Public Records
Tax History Compared to Growth
Tax History
| Year | Tax Paid | Tax Assessment Tax Assessment Total Assessment is a certain percentage of the fair market value that is determined by local assessors to be the total taxable value of land and additions on the property. | Land | Improvement |
|---|---|---|---|---|
| 2026 | -- | $35,535 | $14,700 | $20,835 |
| 2025 | $399 | $35,966 | $14,700 | $21,266 |
| 2024 | $399 | $37,049 | $14,700 | $22,349 |
| 2023 | $371 | $34,299 | $14,245 | $20,054 |
| 2022 | $345 | $27,715 | $10,185 | $17,530 |
| 2021 | $320 | $25,169 | $7,385 | $17,784 |
| 2020 | $300 | $25,052 | $6,930 | $18,122 |
| 2019 | $292 | $25,024 | $7,420 | $17,604 |
| 2018 | $275 | $19,910 | $2,765 | $17,145 |
| 2017 | $267 | $20,640 | $3,430 | $17,210 |
| 2016 | $261 | $14,746 | $2,310 | $12,436 |
| 2015 | $261 | $10,221 | $2,135 | $8,086 |
| 2014 | $253 | $8,927 | $1,855 | $7,072 |
| 2013 | -- | $7,141 | $1,015 | $6,126 |
Source: Public Records
Map
Nearby Homes
- 2065 Wedekind Rd
- 2101 Highview Ct Unit 9
- 2085 Highview Ct Unit 2
- 2085 Highview Ct Unit 1
- 2355 Tripp Dr Unit 7
- 2375 Tripp Dr Unit 11
- 2520 Tripp Dr Unit A1L
- 1955 Wilder St
- 2555 Clear Acre Ln Unit 29-2
- 2555 Clear Acre Ln Unit 16-1
- 2555 Clear Acre Ln Unit 32
- 2555 Clear Acre Ln Unit 9-3
- 2555 Clear Acre Ln Unit 93-3
- 2650 Daffodil Way
- 2090 Fife Dr
- 2735 Daffodil Way
- 1405 Selmi Dr Unit 44
- 2140 Barberry Way
- 1990 Trainer Way
- 2301 Oddie Blvd Unit 56
- 2095 Highview Ct Unit 8
- 2095 Highview Ct Unit 7
- 2095 Highview Ct Unit 1
- 2095 Highview Ct Unit A4L
- 2095 Highview Ct
- 2095 Highview Ct Unit B5L
- 2095 Highview Ct
- 2095 Highview Ct Unit A1L
- 2095 Highview Ct Unit 12
- 2095 Highview Ct Unit A4U
- 2095 Highview Ct Unit B5U
- 2095 Highview Ct Unit A1U
- 2095 Highview Ct Unit A2L
- 2095 Highview Ct Unit 4
- 2095 Highview Ct Unit 11
- 2095 Highview Ct Unit 2
- 2095 Highview Ct Unit 9
- 2095 Highview Ct Unit 5
- 2095 Highview Ct Unit 10
- 2095 Highview Court #7 Unit 7