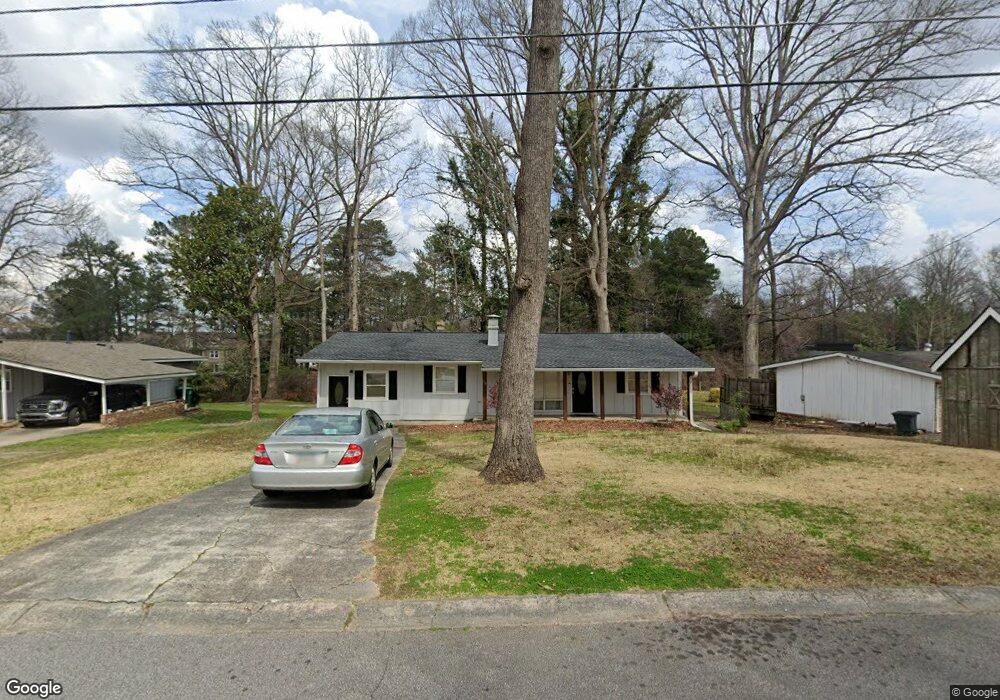
2095 Nancy Cir SE Unit GA Smyrna, GA 30080
Estimated Value: $394,000 - $464,000
2
Beds
3
Baths
1,509
Sq Ft
$285/Sq Ft
Est. Value
About This Home
This home is located at 2095 Nancy Cir SE Unit GA, Smyrna, GA 30080 and is currently estimated at $429,876, approximately $284 per square foot. 2095 Nancy Cir SE Unit GA is a home located in Cobb County with nearby schools including Teasley Elementary School, Campbell Middle School, and Campbell High School.
Ownership History
Date
Name
Owned For
Owner Type
Purchase Details
Closed on
Jul 23, 2024
Sold by
Riddle Matthew
Bought by
Patel Jimmiben Y
Current Estimated Value
Home Financials for this Owner
Home Financials are based on the most recent Mortgage that was taken out on this home.
Original Mortgage
$337,500
Outstanding Balance
$333,438
Interest Rate
6.95%
Mortgage Type
New Conventional
Estimated Equity
$96,438
Purchase Details
Closed on
Feb 28, 2019
Sold by
Aral Investments Llc
Bought by
Riddle Matthew
Home Financials for this Owner
Home Financials are based on the most recent Mortgage that was taken out on this home.
Original Mortgage
$258,020
Interest Rate
4.4%
Mortgage Type
New Conventional
Purchase Details
Closed on
Jan 30, 2018
Sold by
Flummer Matt
Bought by
Aral Investments Llc
Purchase Details
Closed on
Jun 23, 1995
Sold by
Leavens Sandra A
Bought by
Zimmerman Karl and Nguyen Hong
Create a Home Valuation Report for This Property
The Home Valuation Report is an in-depth analysis detailing your home's value as well as a comparison with similar homes in the area
Home Values in the Area
Average Home Value in this Area
Purchase History
| Date | Buyer | Sale Price | Title Company |
|---|---|---|---|
| Patel Jimmiben Y | $450,000 | None Listed On Document | |
| Riddle Matthew | -- | None Listed On Document | |
| Riddle Matthew | $266,000 | -- | |
| Aral Investments Llc | $195,000 | -- | |
| Zimmerman Karl | $75,000 | -- |
Source: Public Records
Mortgage History
| Date | Status | Borrower | Loan Amount |
|---|---|---|---|
| Open | Patel Jimmiben Y | $337,500 | |
| Previous Owner | Riddle Matthew | $258,020 | |
| Closed | Zimmerman Karl | $0 |
Source: Public Records
Tax History Compared to Growth
Tax History
| Year | Tax Paid | Tax Assessment Tax Assessment Total Assessment is a certain percentage of the fair market value that is determined by local assessors to be the total taxable value of land and additions on the property. | Land | Improvement |
|---|---|---|---|---|
| 2025 | $4,302 | $168,380 | $50,000 | $118,380 |
| 2024 | $4,573 | $168,380 | $50,000 | $118,380 |
| 2023 | $4,258 | $156,780 | $40,000 | $116,780 |
| 2022 | $3,224 | $117,824 | $20,000 | $97,824 |
| 2021 | $3,239 | $117,824 | $20,000 | $97,824 |
| 2020 | $2,925 | $106,400 | $18,360 | $88,040 |
| 2019 | $3,179 | $115,656 | $20,000 | $95,656 |
| 2018 | $2,115 | $76,952 | $18,000 | $58,952 |
| 2017 | $1,985 | $76,952 | $18,000 | $58,952 |
| 2016 | $1,818 | $70,504 | $18,000 | $52,504 |
| 2015 | $1,568 | $59,408 | $18,000 | $41,408 |
| 2014 | $1,320 | $49,532 | $0 | $0 |
Source: Public Records
Map
Nearby Homes
- 2327 Goodwood Blvd SE
- 2376 Oakwood Way SE
- 2324 Goodwood Blvd SE
- 1910 Countryside Place SE
- 2040 Argyle Dr SE
- 1601 Countryside Place SE
- 3408 Archerfield Way
- 3416 Archerfield Way
- 3415 Archerfield Way
- 3404 Archerfield Way
- 1913 Heathridge Ct SE
- 1502 Countryside Place SE
- Glover Plan at Archerfield
- Reynolds Plan at Archerfield
- 801 Countryside Place SE
- 1876 Balmoral Rd SE
- 1108 Country Park Dr SE
- 1301 Countryside Place SE
- 3320 Sleepy Ln SE
- 1903 Lochlomand Ln SE
- 2095 Nancy Cir SE
- 2093 Nancy Cir SE
- 2099 Nancy Cir SE
- 2089 Nancy Cir SE
- 2096 Nancy Cir SE
- 3268 Campbell Rd SE
- 2090 Nancy Cir SE
- 3249 Campbell Rd SE
- 2511 Oak Quarters SE
- 2509 Oak Quarters SE
- 2509 Oak Quarters SE Unit 2509
- 2513 Oak Quarters SE Unit 2513
- 2517 Oak Quarters SE
- 2513 Oak Quarters SE
- 2080 Nancy Cir SE
- 3269 Campbell Rd SE
- 2004 Nancy Cir SE
- 2501 Oak Quarters SE Unit 2501
- 2501 Oak Quarters SE
- 2507 Oak Quarters SE