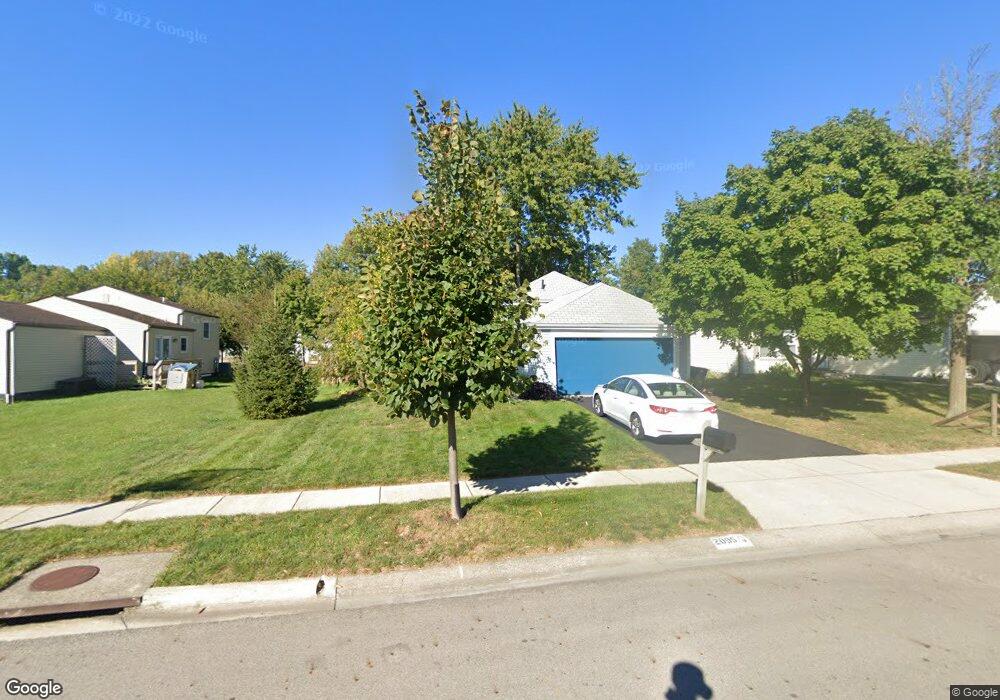
2095 Sari Lynn Ct Hilliard, OH 43026
Sweetwater NeighborhoodEstimated Value: $292,000 - $328,249
3
Beds
2
Baths
1,464
Sq Ft
$214/Sq Ft
Est. Value
About This Home
This home is located at 2095 Sari Lynn Ct, Hilliard, OH 43026 and is currently estimated at $313,062, approximately $213 per square foot. 2095 Sari Lynn Ct is a home located in Franklin County with nearby schools including Hilliard Horizon Elementary School, Hilliard Station Sixth Grade Elementary School, and Hilliard Memorial Middle School.
Ownership History
Date
Name
Owned For
Owner Type
Purchase Details
Closed on
Jul 31, 2000
Sold by
Pernotto R Angelo and Pernotto Loretta K
Bought by
Mcclelland Richard C and Moore Vicki S
Current Estimated Value
Home Financials for this Owner
Home Financials are based on the most recent Mortgage that was taken out on this home.
Original Mortgage
$112,950
Outstanding Balance
$40,868
Interest Rate
8.19%
Estimated Equity
$272,194
Purchase Details
Closed on
Sep 23, 1997
Sold by
Coleman Mary A and Coleman David H
Bought by
Pernotto R Angelo and Pernotto Loretta K
Home Financials for this Owner
Home Financials are based on the most recent Mortgage that was taken out on this home.
Original Mortgage
$104,550
Interest Rate
7.54%
Mortgage Type
FHA
Purchase Details
Closed on
Mar 29, 1996
Sold by
Lawman Jerry A
Bought by
Coleman Mary A and Coleman David H
Home Financials for this Owner
Home Financials are based on the most recent Mortgage that was taken out on this home.
Original Mortgage
$90,000
Interest Rate
5.63%
Mortgage Type
New Conventional
Purchase Details
Closed on
Dec 8, 1992
Create a Home Valuation Report for This Property
The Home Valuation Report is an in-depth analysis detailing your home's value as well as a comparison with similar homes in the area
Home Values in the Area
Average Home Value in this Area
Purchase History
| Date | Buyer | Sale Price | Title Company |
|---|---|---|---|
| Mcclelland Richard C | $118,900 | Franklin Abstract | |
| Pernotto R Angelo | $105,200 | Amerititle Agency Inc | |
| Coleman Mary A | $95,000 | -- | |
| -- | $78,000 | -- |
Source: Public Records
Mortgage History
| Date | Status | Borrower | Loan Amount |
|---|---|---|---|
| Open | Mcclelland Richard C | $112,950 | |
| Closed | Pernotto R Angelo | $104,550 | |
| Closed | Coleman Mary A | $90,000 |
Source: Public Records
Tax History Compared to Growth
Tax History
| Year | Tax Paid | Tax Assessment Tax Assessment Total Assessment is a certain percentage of the fair market value that is determined by local assessors to be the total taxable value of land and additions on the property. | Land | Improvement |
|---|---|---|---|---|
| 2024 | $4,903 | $86,810 | $30,000 | $56,810 |
| 2023 | $4,247 | $86,800 | $29,995 | $56,805 |
| 2022 | $3,634 | $59,470 | $12,810 | $46,660 |
| 2021 | $3,630 | $59,470 | $12,810 | $46,660 |
| 2020 | $3,620 | $59,470 | $12,810 | $46,660 |
| 2019 | $3,501 | $49,110 | $10,260 | $38,850 |
| 2018 | $3,433 | $49,110 | $10,260 | $38,850 |
| 2017 | $3,483 | $49,110 | $10,260 | $38,850 |
| 2016 | $3,339 | $41,800 | $9,630 | $32,170 |
| 2015 | $3,139 | $41,800 | $9,630 | $32,170 |
| 2014 | $3,094 | $41,800 | $9,630 | $32,170 |
| 2013 | $1,617 | $41,790 | $9,625 | $32,165 |
Source: Public Records
Map
Nearby Homes
- 2145 Jeffey Dr
- 2161 Jeffey Dr
- 5639 Nike Dr
- 2195 Jeffey Dr
- 5670 Valencia Park Blvd Unit 33D
- 5824 Brinkwater Blvd
- 5594 Bluegrass Way
- 2014 Burbridge Ln Unit 29C
- 2002 Jasper Ln Unit 26D
- 5559 Fescue Dr
- 5763 Nike Dr
- 5739 Stonepath Dr
- 5589 Valencia Park Blvd Unit 11A
- 5553 Valencia Park Blvd Unit 6A
- 5503 Nike Dr
- 1856 Hobbes Dr Unit 73C
- 5983 Cape Coral Ln
- 1807 Messner Dr Unit 65D
- 1854 Galleon Blvd
- 1768 Ridgebury Dr Unit 135A
- 2103 Sari Lynn Ct
- 2111 Sari Lynn Ct
- 2096 Jeffey Dr
- 2088 Jeffey Dr
- 2104 Jeffey Dr
- 2090 Sari Lynn Ct
- 2112 Jeffey Dr
- 2098 Sari Lynn Ct
- 2082 Sari Lynn Ct
- 2119 Sari Lynn Ct
- 2106 Sari Lynn Ct
- 5753 Angie Dr
- 2120 Jeffey Dr
- 5761 Angie Dr
- 5745 Angie Dr
- 5737 Angie Dr
- 2114 Sari Lynn Ct
- 2128 Jeffey Dr
- 2127 Sari Lynn Ct
- 2089 Steffi Dr