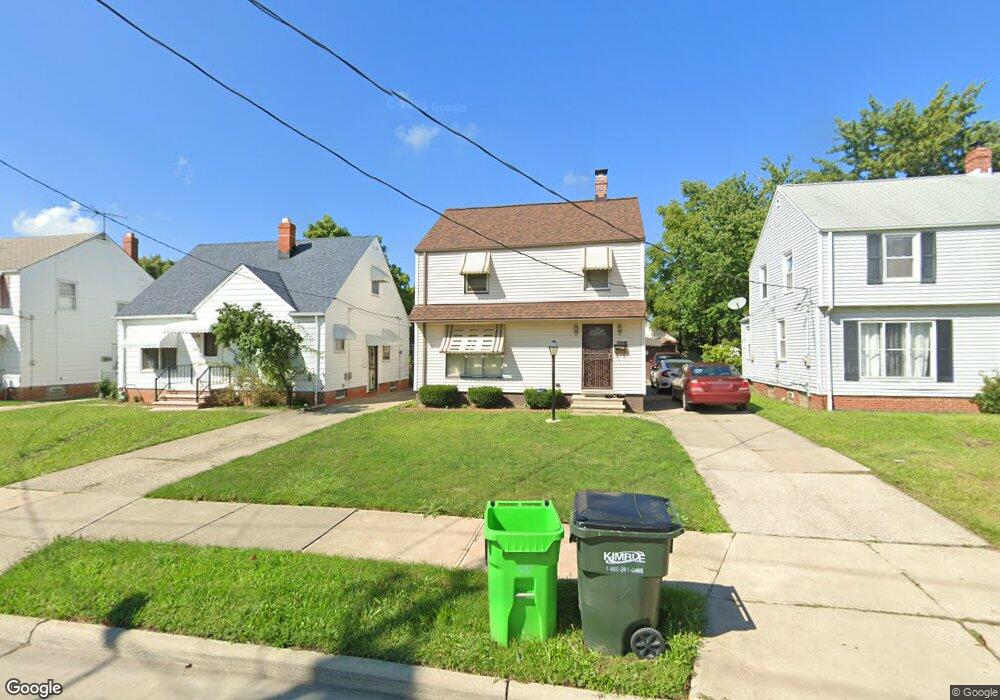
20951 Naumann Ave Euclid, OH 44123
Estimated Value: $111,721 - $167,000
3
Beds
1
Bath
1,056
Sq Ft
$124/Sq Ft
Est. Value
About This Home
This home is located at 20951 Naumann Ave, Euclid, OH 44123 and is currently estimated at $131,430, approximately $124 per square foot. 20951 Naumann Ave is a home located in Cuyahoga County with nearby schools including Arbor Elementary School, Euclid Middle School, and Euclid High School.
Ownership History
Date
Name
Owned For
Owner Type
Purchase Details
Closed on
Aug 20, 2001
Sold by
Savochka Rose Ann and Savochka Steven Joseph
Bought by
Guerry Margaret S
Current Estimated Value
Home Financials for this Owner
Home Financials are based on the most recent Mortgage that was taken out on this home.
Original Mortgage
$83,230
Outstanding Balance
$32,373
Interest Rate
7.11%
Mortgage Type
FHA
Estimated Equity
$99,057
Purchase Details
Closed on
Oct 4, 1978
Sold by
Savochka Steve J
Bought by
Savochka Millie A
Purchase Details
Closed on
Jun 27, 1978
Sold by
Savochka Steve J and Savochka Millie A
Bought by
Savochka Steve J
Purchase Details
Closed on
Jan 1, 1975
Bought by
Savochka Steve J and Savochka Millie A
Create a Home Valuation Report for This Property
The Home Valuation Report is an in-depth analysis detailing your home's value as well as a comparison with similar homes in the area
Home Values in the Area
Average Home Value in this Area
Purchase History
| Date | Buyer | Sale Price | Title Company |
|---|---|---|---|
| Guerry Margaret S | $83,900 | Executive Title Agency Corp | |
| Savochka Millie A | -- | -- | |
| Savochka Steve J | -- | -- | |
| Savochka Steve J | -- | -- |
Source: Public Records
Mortgage History
| Date | Status | Borrower | Loan Amount |
|---|---|---|---|
| Open | Guerry Margaret S | $83,230 |
Source: Public Records
Tax History Compared to Growth
Tax History
| Year | Tax Paid | Tax Assessment Tax Assessment Total Assessment is a certain percentage of the fair market value that is determined by local assessors to be the total taxable value of land and additions on the property. | Land | Improvement |
|---|---|---|---|---|
| 2024 | $2,161 | $40,460 | $7,245 | $33,215 |
| 2023 | $1,435 | $24,780 | $5,670 | $19,110 |
| 2022 | $1,438 | $24,780 | $5,670 | $19,110 |
| 2021 | $1,586 | $24,780 | $5,670 | $19,110 |
| 2020 | $1,141 | $18,800 | $4,310 | $14,490 |
| 2019 | $1,020 | $53,700 | $12,300 | $41,400 |
| 2018 | $1,028 | $18,800 | $4,310 | $14,490 |
| 2017 | $956 | $16,450 | $2,870 | $13,580 |
| 2016 | $958 | $16,450 | $2,870 | $13,580 |
| 2015 | $879 | $16,450 | $2,870 | $13,580 |
| 2014 | $879 | $16,450 | $2,870 | $13,580 |
Source: Public Records
Map
Nearby Homes
- 20830 Tracy Ave
- 21130 Arbor Ave
- 20801 Morris Ave
- 20400 Tracy Ave
- 21170 Wilmore Ave
- 20671 Wilmore Ave
- 20760 Westport Ave
- 20231 Nicholas Ave
- 20450 Wilmore Ave
- 20921 Westport Ave
- 21051 Westport Ave
- 828 E 216th St
- 20561 Westport Ave
- 20101 Tracy Ave
- 21670 Wilmore Ave
- 21181 Ball Ave
- 560 E 200th St
- 20430 Miller Ave
- 21481 Ball Ave
- 21440 Fuller Ave
- 20971 Naumann Ave
- 20931 Naumann Ave
- 21001 Naumann Ave
- 20901 Naumann Ave
- 20950 Nicholas Ave
- 20930 Nicholas Ave
- 20970 Nicholas Ave
- 21031 Naumann Ave
- 20871 Naumann Ave
- 20900 Nicholas Ave
- 21000 Nicholas Ave
- 21051 Naumann Ave
- 20954 Naumann Ave
- 20851 Naumann Ave
- 20982 Naumann Ave
- 20930 Naumann Ave
- 20870 Nicholas Ave
- 21012 Naumann Ave
- 21050 Nicholas Ave
- 20890 Naumann Ave