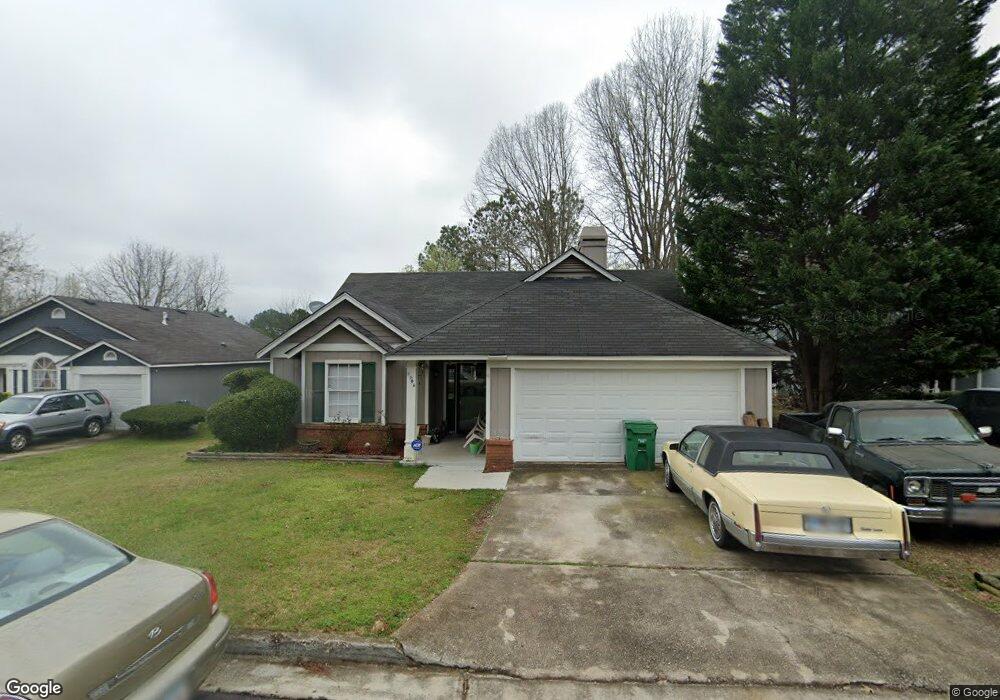
2096 W Morgans Bluff Ct Lithonia, GA 30058
Estimated Value: $203,649 - $238,000
3
Beds
2
Baths
1,372
Sq Ft
$159/Sq Ft
Est. Value
About This Home
This home is located at 2096 W Morgans Bluff Ct, Lithonia, GA 30058 and is currently estimated at $218,162, approximately $159 per square foot. 2096 W Morgans Bluff Ct is a home located in DeKalb County with nearby schools including Stoneview Elementary School, Lithonia Middle School, and Lithonia High School.
Ownership History
Date
Name
Owned For
Owner Type
Purchase Details
Closed on
Apr 24, 2006
Sold by
Solomon Andrea
Bought by
Westminster Trust
Current Estimated Value
Purchase Details
Closed on
Mar 13, 2003
Sold by
Docsol Enterprises Llc
Bought by
Moton-Solomon Andrea
Purchase Details
Closed on
Dec 31, 2002
Sold by
Docsol Enterprises Llc
Bought by
Solomon Andrea
Purchase Details
Closed on
Nov 21, 2002
Sold by
Solomon Andrea
Bought by
Docsol Enterprise Sllc
Purchase Details
Closed on
Apr 3, 2002
Sold by
Moton Andrea
Bought by
Solomon Andrea
Purchase Details
Closed on
Mar 28, 1997
Sold by
Grant Naomi and Grant Catherine
Bought by
Colomon Andrea and Solomon Christopher
Home Financials for this Owner
Home Financials are based on the most recent Mortgage that was taken out on this home.
Original Mortgage
$69,950
Interest Rate
9%
Mortgage Type
FHA
Create a Home Valuation Report for This Property
The Home Valuation Report is an in-depth analysis detailing your home's value as well as a comparison with similar homes in the area
Home Values in the Area
Average Home Value in this Area
Purchase History
| Date | Buyer | Sale Price | Title Company |
|---|---|---|---|
| Westminster Trust | -- | -- | |
| Moton-Solomon Andrea | -- | -- | |
| Solomon Andrea | -- | -- | |
| Docsol Enterprise Sllc | -- | -- | |
| Solomon Andrea | -- | -- | |
| Colomon Andrea | $13,400 | -- |
Source: Public Records
Mortgage History
| Date | Status | Borrower | Loan Amount |
|---|---|---|---|
| Previous Owner | Colomon Andrea | $69,950 |
Source: Public Records
Tax History Compared to Growth
Tax History
| Year | Tax Paid | Tax Assessment Tax Assessment Total Assessment is a certain percentage of the fair market value that is determined by local assessors to be the total taxable value of land and additions on the property. | Land | Improvement |
|---|---|---|---|---|
| 2025 | $4,450 | $90,040 | $12,000 | $78,040 |
| 2024 | $4,148 | $83,920 | $6,000 | $77,920 |
| 2023 | $4,148 | $76,160 | $6,000 | $70,160 |
| 2022 | $3,055 | $62,400 | $6,000 | $56,400 |
| 2021 | $2,548 | $50,080 | $6,000 | $44,080 |
| 2020 | $2,208 | $42,880 | $6,000 | $36,880 |
| 2019 | $2,079 | $40,240 | $6,000 | $34,240 |
| 2018 | $1,659 | $37,680 | $3,280 | $34,400 |
| 2017 | $1,669 | $30,760 | $3,280 | $27,480 |
| 2016 | $1,471 | $26,200 | $3,280 | $22,920 |
| 2014 | $945 | $13,960 | $3,280 | $10,680 |
Source: Public Records
Map
Nearby Homes
- 6396 Stablewood Way
- 2107 Bedford Ct
- 6351 Stablewood Way
- 2060 Bedford Ct Unit 1
- 6420 Marbut Rd
- 2191 Phillips Rd
- 2041 Marbut Trace
- 6403 Charter Way
- 2116 Charter Ln
- 2049 Charter Ln
- 6260 Marbut Farms Terrace
- 6534 Charter Way
- 2281 Rambling Way
- 1882 Corners Cir
- 6510 Charter Way
- 6202 Saint Christophers Ct
- 6248 Marbut Farms Ln
- 2216 Marbut Farms Trace
- 6185 Marbut Farms Chase
- 2338 Rambling Way
- 2100 W Morgans Bluff Ct Unit 30
- 2100 W Morgans Bluff Ct
- 2090 W Morgans Bluff Ct
- 2093 Charles Cudd Ct
- 2097 Charles Cudd Ct
- 2087 Charles Cudd Ct
- 2106 W Morgans Bluff Ct
- 2086 W Morgans Bluff Ct
- 2097 Charles Cubb Ct
- 2103 Charles Cudd Ct
- 2103 Charles Cudd Ct Unit 2103
- 2103 Charles Cudd Ct
- 2095 W Morgans Bluff Ct
- 2083 Charles Cudd Ct
- 2089 W Morgans Bluff Ct
- 2099 W Morgans Bluff Ct
- 2082 W Morgans Bluff Ct
- 5859 Greystone Dr
- 5744 Calle Vista Dr
- 5756 Calle Vista Dr