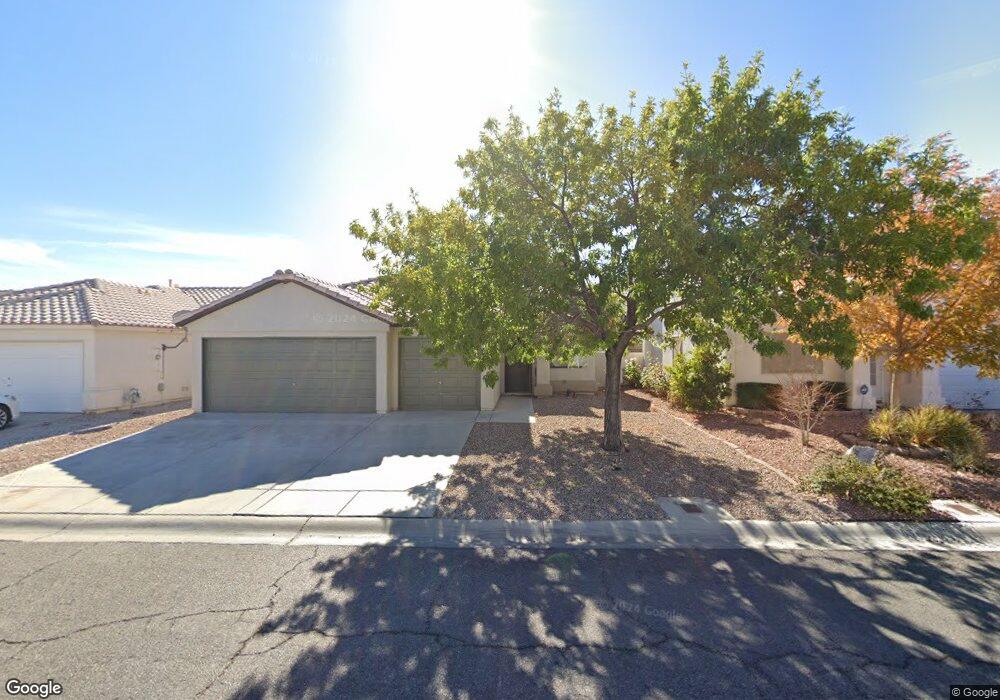
2097 Merano Ct Las Vegas, NV 89123
Silverado Ranch NeighborhoodEstimated Value: $429,437 - $455,000
3
Beds
2
Baths
1,458
Sq Ft
$301/Sq Ft
Est. Value
About This Home
This home is located at 2097 Merano Ct, Las Vegas, NV 89123 and is currently estimated at $438,609, approximately $300 per square foot. 2097 Merano Ct is a home located in Clark County with nearby schools including Roberta C Cartwright Elementary School, Charles Silvestri Junior High School, and Silverado High School.
Ownership History
Date
Name
Owned For
Owner Type
Purchase Details
Closed on
Mar 26, 2019
Sold by
Canillo Liwayway D
Bought by
Tugboat Llc 2097 Merano Ct Series
Current Estimated Value
Purchase Details
Closed on
Mar 31, 2007
Sold by
Canillo John M and Canillo Liwayway D
Bought by
Canillo Family Trust
Purchase Details
Closed on
Jun 26, 2002
Sold by
Lopez Mario A
Bought by
Canillo John and Canillo Liwayway
Home Financials for this Owner
Home Financials are based on the most recent Mortgage that was taken out on this home.
Original Mortgage
$138,150
Interest Rate
6.86%
Mortgage Type
Purchase Money Mortgage
Purchase Details
Closed on
Jan 16, 1997
Sold by
Pageantry Xi Riva Lp
Bought by
Lopez Mario A
Home Financials for this Owner
Home Financials are based on the most recent Mortgage that was taken out on this home.
Original Mortgage
$121,821
Interest Rate
7.46%
Mortgage Type
FHA
Create a Home Valuation Report for This Property
The Home Valuation Report is an in-depth analysis detailing your home's value as well as a comparison with similar homes in the area
Home Values in the Area
Average Home Value in this Area
Purchase History
| Date | Buyer | Sale Price | Title Company |
|---|---|---|---|
| Tugboat Llc 2097 Merano Ct Series | $285,000 | Chicago Title Las Vegas | |
| Canillo Family Trust | -- | None Available | |
| Canillo John | $153,500 | Fidelity National Title | |
| Lopez Mario A | $124,500 | Nevada Title Company |
Source: Public Records
Mortgage History
| Date | Status | Borrower | Loan Amount |
|---|---|---|---|
| Previous Owner | Canillo John | $138,150 | |
| Previous Owner | Lopez Mario A | $121,821 |
Source: Public Records
Tax History Compared to Growth
Tax History
| Year | Tax Paid | Tax Assessment Tax Assessment Total Assessment is a certain percentage of the fair market value that is determined by local assessors to be the total taxable value of land and additions on the property. | Land | Improvement |
|---|---|---|---|---|
| 2025 | $2,279 | $99,694 | $39,900 | $59,794 |
| 2024 | $2,111 | $99,694 | $39,900 | $59,794 |
| 2023 | $2,111 | $99,454 | $42,700 | $56,754 |
| 2022 | $1,955 | $80,655 | $28,700 | $51,955 |
| 2021 | $1,810 | $75,774 | $26,250 | $49,524 |
| 2020 | $1,678 | $75,405 | $26,250 | $49,155 |
| 2019 | $1,572 | $71,701 | $23,100 | $48,601 |
| 2018 | $1,500 | $65,089 | $18,200 | $46,889 |
| 2017 | $1,920 | $65,455 | $17,850 | $47,605 |
| 2016 | $1,405 | $59,918 | $12,950 | $46,968 |
| 2015 | $1,358 | $51,218 | $10,850 | $40,368 |
| 2014 | $1,316 | $43,529 | $7,000 | $36,529 |
Source: Public Records
Map
Nearby Homes
- 2195 Merano Ct
- 2216 Madica Ave
- 1945 Bova Matrina Ct
- 2196 Pescara Ct
- 1905 Bocale Ct
- 9560 Summerfest St
- 9620 Orchid Bay Dr
- 2300 E Silverado Ranch Blvd Unit 2112
- 2300 E Silverado Ranch Blvd Unit 2033
- 2300 E Silverado Ranch Blvd Unit 2161
- 2300 E Silverado Ranch Blvd Unit 1080
- 2300 E Silverado Ranch Blvd Unit 1106
- 2300 E Silverado Ranch Blvd Unit 2196
- 2300 E Silverado Ranch Blvd Unit 2158
- 2300 E Silverado Ranch Blvd Unit 1074
- 2300 E Silverado Ranch Blvd Unit 1180
- 2300 E Silverado Ranch Blvd Unit 2133
- 2300 E Silverado Ranch Blvd Unit 2162
- 2300 E Silverado Ranch Blvd Unit 2040
- 2300 E Silverado Ranch Blvd Unit 1151
- 2109 Merano Ct Unit 4
- 2085 Merano Ct Unit 4
- 2098 Madica Ave
- 2121 Merano Ct
- 2073 Merano Ct
- 2086 Madica Ave
- 2110 Madica Ave
- 2122 Madica Ave Unit 4
- 2074 Madica Ave
- 2061 Merano Ct
- 2110 Merano Ct
- 2086 Merano Ct
- 2133 Merano Ct
- 2122 Merano Ct
- 2062 Madica Ave
- 2134 Madica Ave
- 2049 Merano Ct Unit 4
- 2049 Merano Ct Unit No
- 2062 Merano Ct
- 2134 Merano Ct