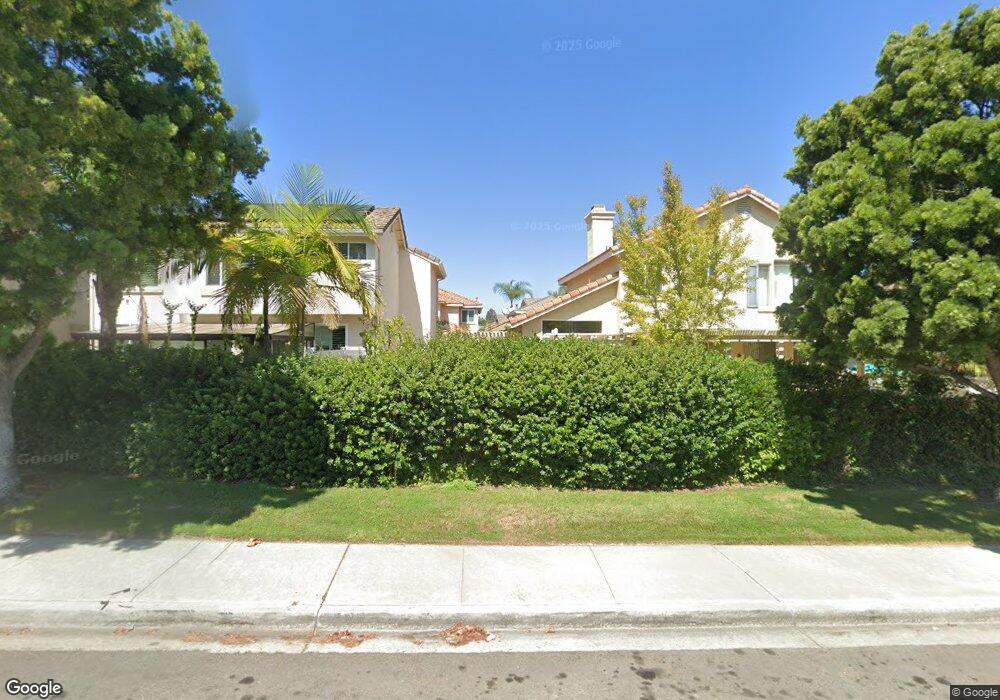
2098 Fairhope Loop Unit 182 Vista, CA 92081
Shadowridge NeighborhoodEstimated Value: $786,812 - $856,000
3
Beds
4
Baths
1,474
Sq Ft
$558/Sq Ft
Est. Value
About This Home
This home is located at 2098 Fairhope Loop Unit 182, Vista, CA 92081 and is currently estimated at $822,703, approximately $558 per square foot. 2098 Fairhope Loop Unit 182 is a home located in San Diego County with nearby schools including Lake Elementary School, Madison Middle School, and Rancho Buena Vista High School.
Ownership History
Date
Name
Owned For
Owner Type
Purchase Details
Closed on
Dec 20, 2016
Sold by
Douglas Linda S
Bought by
Douglas Linda S
Current Estimated Value
Purchase Details
Closed on
Oct 14, 2016
Sold by
Abrahamowicz Richard
Bought by
Douglas Linda S
Home Financials for this Owner
Home Financials are based on the most recent Mortgage that was taken out on this home.
Original Mortgage
$372,000
Outstanding Balance
$298,228
Interest Rate
3.46%
Mortgage Type
New Conventional
Estimated Equity
$524,475
Purchase Details
Closed on
Jul 8, 2016
Sold by
Shartzer Barbara
Bought by
Abrahamowicz Richard
Purchase Details
Closed on
Sep 6, 2006
Sold by
Stanberry Ivan O
Bought by
Stanberry Ivan O
Purchase Details
Closed on
Aug 15, 1995
Sold by
Heritage Vista Lp
Bought by
Stanberry Ivan O and Stanberry Mildred D
Create a Home Valuation Report for This Property
The Home Valuation Report is an in-depth analysis detailing your home's value as well as a comparison with similar homes in the area
Home Values in the Area
Average Home Value in this Area
Purchase History
| Date | Buyer | Sale Price | Title Company |
|---|---|---|---|
| Douglas Linda S | -- | None Available | |
| Douglas Linda S | $476,500 | Corinthian Title Company | |
| Abrahamowicz Richard | $420,000 | Corinthian Title Company | |
| Stanberry Ivan O | -- | None Available | |
| Stanberry Ivan O | $159,000 | First American Title |
Source: Public Records
Mortgage History
| Date | Status | Borrower | Loan Amount |
|---|---|---|---|
| Open | Douglas Linda S | $372,000 |
Source: Public Records
Tax History
| Year | Tax Paid | Tax Assessment Tax Assessment Total Assessment is a certain percentage of the fair market value that is determined by local assessors to be the total taxable value of land and additions on the property. | Land | Improvement |
|---|---|---|---|---|
| 2025 | $6,570 | $553,011 | $294,938 | $258,073 |
| 2024 | $6,570 | $542,168 | $289,155 | $253,013 |
| 2023 | $6,428 | $531,538 | $283,486 | $248,052 |
| 2022 | $6,412 | $521,117 | $277,928 | $243,189 |
| 2021 | $6,270 | $510,900 | $272,479 | $238,421 |
| 2020 | $5,556 | $505,663 | $269,686 | $235,977 |
| 2019 | $6,146 | $495,749 | $264,399 | $231,350 |
| 2018 | $5,874 | $486,029 | $259,215 | $226,814 |
| 2017 | $5,777 | $476,500 | $254,133 | $222,367 |
| 2016 | $4,790 | $380,718 | $203,050 | $177,668 |
| 2015 | $3,004 | $219,765 | $69,103 | $150,662 |
| 2014 | $2,933 | $215,461 | $67,750 | $147,711 |
Source: Public Records
Map
Nearby Homes
- 2082 Fairhope Loop Unit 186
- 1839 Saint Thomas Rd
- 1831 Monserrat Way
- 1816 Cayman Way
- 1684 Countryside Dr
- 1734 Countryside Dr
- 1959 Oxford Ct
- 1979 Oxford Ct
- 1977 White Birch Dr
- 1831 Olympus Loop Dr
- 1510 Golfcrest Place
- 2198 Redwood Crest
- 1672 Olympus Loop Dr
- 1667 Olympus Loop Dr
- 1533 Promontory Ridge Way
- 3732 Via Cabrillo
- 2592 Coronado Place
- 6055 Dassia Way
- 1387 Longfellow Rd
- 6015 Dassia Way
- 2069 Fairhope Loop
- 2073 Fairhope Loop
- 2097 Courage St
- 2086 Fairhope Loop
- 2090 Fairhope Loop Unit 184
- 2065 Fairhope Loop
- 2074 Fairhope Loop Unit 188
- 2077 Fairhope Loop
- 2094 Fairhope Loop Unit 183
- 2070 Fairhope Loop
- 2078 Fairhope Loop
- 2066 Fairhope Loop
- 2081 Fairhope Loop
- 2062 Fairhope Loop
- 2079 Bravado St
- 2046 Fairhope Loop
- 2076 Courage St
- 2061 Fairhope Loop
- 2093 Courage St
- 2089 Courage St
Your Personal Tour Guide
Ask me questions while you tour the home.