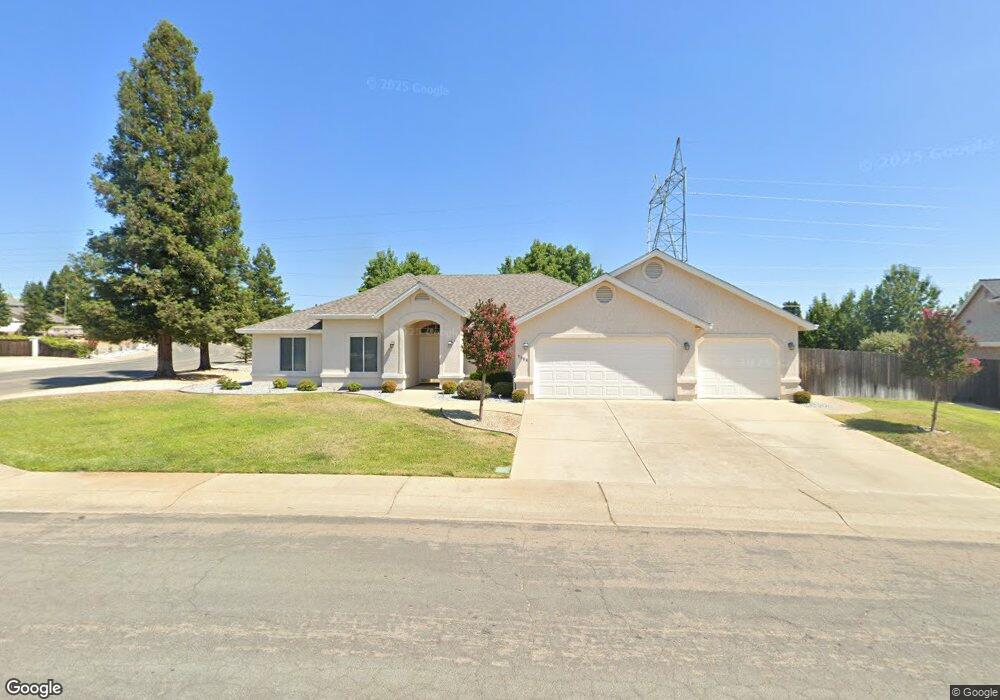
2098 Trailview Ct Unit 1 Redding, CA 96003
Quartz Hill NeighborhoodEstimated Value: $483,000 - $525,000
4
Beds
2
Baths
2,044
Sq Ft
$250/Sq Ft
Est. Value
About This Home
This home is located at 2098 Trailview Ct Unit 1, Redding, CA 96003 and is currently estimated at $511,105, approximately $250 per square foot. 2098 Trailview Ct Unit 1 is a home located in Shasta County with nearby schools including Turtle Bay, Sequoia Middle School, and Shasta High School.
Ownership History
Date
Name
Owned For
Owner Type
Purchase Details
Closed on
Apr 12, 2005
Sold by
Mcmahon Keith
Bought by
Gordon James N and Gordon Mildria M
Current Estimated Value
Home Financials for this Owner
Home Financials are based on the most recent Mortgage that was taken out on this home.
Original Mortgage
$272,000
Outstanding Balance
$140,910
Interest Rate
5.84%
Mortgage Type
Purchase Money Mortgage
Estimated Equity
$370,195
Purchase Details
Closed on
Aug 2, 1999
Sold by
Mcmahon Roseanne
Bought by
Mcmahon Keith
Home Financials for this Owner
Home Financials are based on the most recent Mortgage that was taken out on this home.
Original Mortgage
$132,800
Interest Rate
8.12%
Mortgage Type
Purchase Money Mortgage
Purchase Details
Closed on
Nov 2, 1998
Sold by
Spiering Charles and Spiering Tammy
Bought by
Spiering Tammy Lavel
Create a Home Valuation Report for This Property
The Home Valuation Report is an in-depth analysis detailing your home's value as well as a comparison with similar homes in the area
Home Values in the Area
Average Home Value in this Area
Purchase History
| Date | Buyer | Sale Price | Title Company |
|---|---|---|---|
| Gordon James N | $340,000 | First American Title Co | |
| Mcmahon Keith | -- | Placer Title Company | |
| Mcmahon Keith | $166,000 | Placer Title Company | |
| Spiering Tammy Lavel | -- | Chicago Title Co |
Source: Public Records
Mortgage History
| Date | Status | Borrower | Loan Amount |
|---|---|---|---|
| Open | Gordon James N | $272,000 | |
| Previous Owner | Mcmahon Keith | $132,800 | |
| Closed | Mcmahon Keith | $33,200 |
Source: Public Records
Tax History
| Year | Tax Paid | Tax Assessment Tax Assessment Total Assessment is a certain percentage of the fair market value that is determined by local assessors to be the total taxable value of land and additions on the property. | Land | Improvement |
|---|---|---|---|---|
| 2025 | $4,916 | $473,911 | $167,260 | $306,651 |
| 2024 | $4,847 | $464,620 | $163,981 | $300,639 |
| 2023 | $4,847 | $455,511 | $160,766 | $294,745 |
| 2022 | $4,763 | $446,580 | $157,614 | $288,966 |
| 2021 | $4,362 | $403,200 | $78,400 | $324,800 |
| 2020 | $3,988 | $360,000 | $70,000 | $290,000 |
| 2019 | $3,856 | $360,000 | $70,000 | $290,000 |
| 2018 | $3,941 | $360,000 | $70,000 | $290,000 |
| 2017 | $3,748 | $335,000 | $65,000 | $270,000 |
| 2016 | $3,538 | $320,000 | $65,000 | $255,000 |
| 2015 | $3,440 | $315,000 | $65,000 | $250,000 |
| 2014 | $3,338 | $300,000 | $65,000 | $235,000 |
Source: Public Records
Map
Nearby Homes
- 370 River Park Dr
- 366 River Park Dr
- 2520 Snow Ln
- 1833 Del Mar Ave
- 500-550 Quartz Hill Rd
- 805 Christine Ave
- 303 Pearl St
- 1723 Del Mar Ave
- 2860 Panorama Dr
- 3041 Panorama Dr
- 1715 Barbara Rd
- 686 Coronado St
- 3243 Stanford Dr
- 1119 River Ridge Dr
- 166 Quartz Hill Rd
- 605 Quartz Hill Rd
- 750 Oleta Dr
- 3360 Stanford Dr
- 0 Lake Blvd
- 830 Middle St
- 2098 Trailview Ct
- 2084 Trailview Ct
- 2091 Trailview Ct Unit 1
- 2091 Trailview Ct
- 202 Ironwood Ln
- 202 Ironwood Way Unit 1
- 0 Ironwood Ln
- 214 Ironwood Ln
- 2070 Trailview Ct
- 194 Ironwood Ln
- 21 Trailview Ct
- 0 Trailview Ct
- 191 Ironwood Ln Unit 1
- 191 Ironwood Ln
- 2077 Trailview Ct Unit 1
- 2077 Trailview Ct
- 184 Ironwood Ln
- 2056 Trailview Ct
- 225 Ironwood Ln
- 187 Ironwood Ln
Your Personal Tour Guide
Ask me questions while you tour the home.