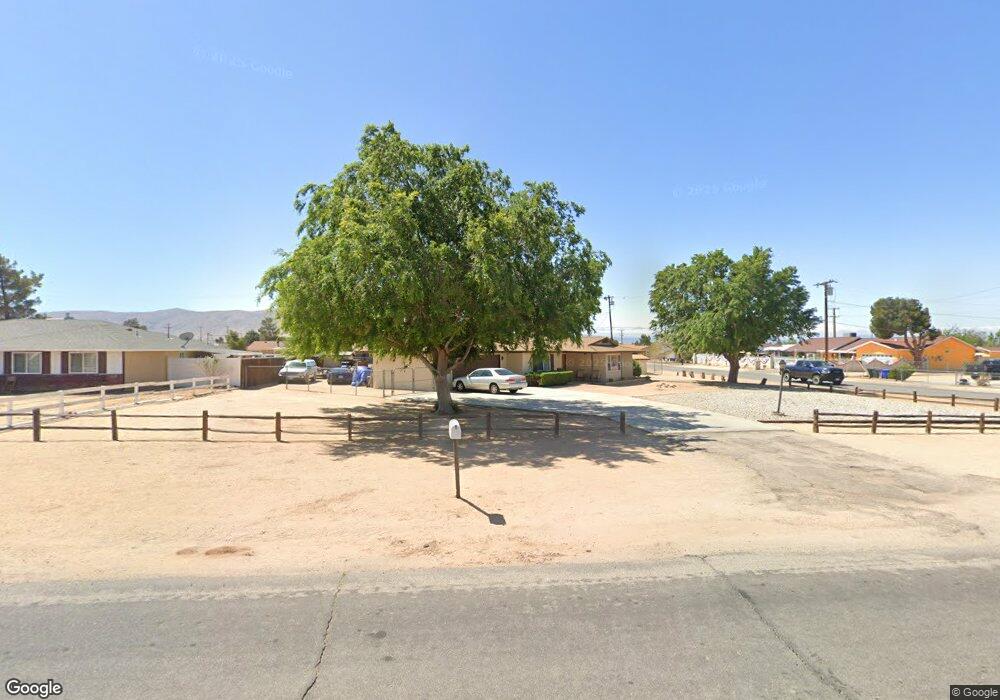
20989 Sandia Rd Apple Valley, CA 92308
High Desert NeighborhoodEstimated Value: $374,769 - $391,000
3
Beds
2
Baths
1,521
Sq Ft
$253/Sq Ft
Est. Value
About This Home
This home is located at 20989 Sandia Rd, Apple Valley, CA 92308 and is currently estimated at $384,192, approximately $252 per square foot. 20989 Sandia Rd is a home located in San Bernardino County with nearby schools including Sandia Elementary School and Apple Valley High School.
Ownership History
Date
Name
Owned For
Owner Type
Purchase Details
Closed on
Jan 30, 2025
Sold by
White Donald R
Bought by
Donald Raymond White Trust and White
Current Estimated Value
Purchase Details
Closed on
May 3, 2006
Sold by
Blackbourn Robert A
Bought by
Bourn Family Lp and Blackbourn Robert Arthur
Purchase Details
Closed on
Jan 17, 2006
Sold by
Haney Dee Dee
Bought by
Haney Bobby Joe
Create a Home Valuation Report for This Property
The Home Valuation Report is an in-depth analysis detailing your home's value as well as a comparison with similar homes in the area
Home Values in the Area
Average Home Value in this Area
Purchase History
| Date | Buyer | Sale Price | Title Company |
|---|---|---|---|
| Donald Raymond White Trust | -- | None Listed On Document | |
| Bourn Family Lp | -- | None Available | |
| Haney Bobby Joe | -- | None Available |
Source: Public Records
Tax History
| Year | Tax Paid | Tax Assessment Tax Assessment Total Assessment is a certain percentage of the fair market value that is determined by local assessors to be the total taxable value of land and additions on the property. | Land | Improvement |
|---|---|---|---|---|
| 2025 | $1,431 | $115,523 | $9,056 | $106,467 |
| 2024 | $1,319 | $113,257 | $8,878 | $104,379 |
| 2023 | $1,305 | $111,036 | $8,704 | $102,332 |
| 2022 | $1,283 | $108,858 | $8,533 | $100,325 |
| 2021 | $1,253 | $106,724 | $8,366 | $98,358 |
| 2020 | $1,236 | $105,629 | $8,280 | $97,349 |
| 2019 | $1,212 | $103,558 | $8,118 | $95,440 |
| 2018 | $1,181 | $101,528 | $7,959 | $93,569 |
| 2017 | $1,163 | $99,537 | $7,803 | $91,734 |
| 2016 | $1,084 | $97,585 | $7,650 | $89,935 |
| 2015 | $1,067 | $96,119 | $7,535 | $88,584 |
| 2014 | $1,051 | $94,236 | $7,387 | $86,849 |
Source: Public Records
Map
Nearby Homes
- 11591 Kiowa Rd
- 21110 Sandia Rd
- 11679 Winterhawk Way
- 11911 Kiowa Rd
- 11468 Kiowa Rd
- 11651 Anza Rd
- 3 Del Oro Rd
- 21100 Bear Valley Rd
- 11724 Jamacha Rd
- 10350 Merino Ave
- 11300 Merino Ave
- 43431107 Kiowa Place
- 11414 Serra Rd Unit 15
- 11414 Serra Rd Unit 21
- 11414 Serra Rd
- 11414 Serra Rd Unit 46
- 11414 Serra Rd Unit 57
- 11852 Jamacha Rd
- 21336 Laguna Rd
- 11182 Caribou Ave
- 20999 Sandia Rd
- 21015 Sandia Rd
- 20998 Chama Rd
- 11690 Chimayo Rd
- 11674 Chimayo Rd
- 11709 Chimayo Rd
- 21010 Chama Rd
- 11650 Chimayo Rd
- 21031 Sandia Rd
- 21006 Sandia Rd
- 11712 Chimayo Rd
- 11721 Chimayo Rd
- 21028 Chama Rd
- 21018 Sandia Rd
- 20955 Sandia Rd
- 11675 Kiowa Rd
- 11734 Chimayo Rd
- 21045 Sandia Rd
- 20991 Chama Rd
- 11655 Kiowa Rd
Your Personal Tour Guide
Ask me questions while you tour the home.