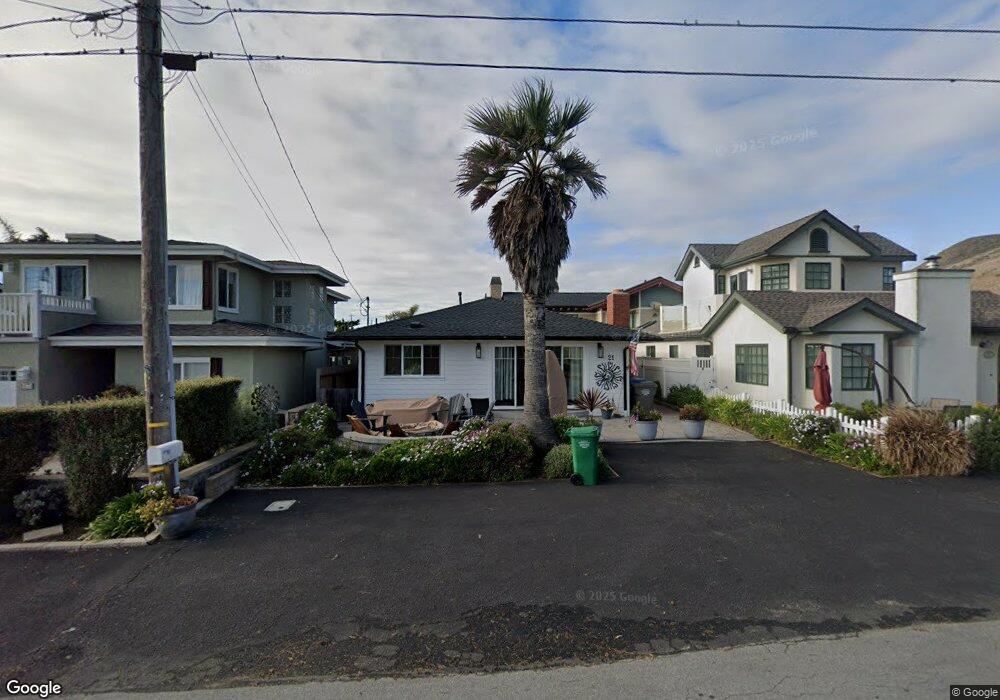
21 15th St Cayucos, CA 93430
Cayucos NeighborhoodEstimated Value: $980,813 - $1,351,000
2
Beds
1
Bath
1,084
Sq Ft
$1,034/Sq Ft
Est. Value
About This Home
This home is located at 21 15th St, Cayucos, CA 93430 and is currently estimated at $1,121,203, approximately $1,034 per square foot. 21 15th St is a home located in San Luis Obispo County.
Ownership History
Date
Name
Owned For
Owner Type
Purchase Details
Closed on
Jul 25, 2023
Sold by
Noble Melanie
Bought by
Melanie Sue Noble Living Trust and Noble
Current Estimated Value
Purchase Details
Closed on
Apr 4, 2017
Sold by
Barnett Mary Louise
Bought by
Noble Melanie
Home Financials for this Owner
Home Financials are based on the most recent Mortgage that was taken out on this home.
Original Mortgage
$270,000
Interest Rate
4.1%
Mortgage Type
New Conventional
Purchase Details
Closed on
Aug 31, 2004
Sold by
Noble Raymond Thomas
Bought by
Noble Melanie
Create a Home Valuation Report for This Property
The Home Valuation Report is an in-depth analysis detailing your home's value as well as a comparison with similar homes in the area
Home Values in the Area
Average Home Value in this Area
Purchase History
| Date | Buyer | Sale Price | Title Company |
|---|---|---|---|
| Melanie Sue Noble Living Trust | -- | None Listed On Document | |
| Noble Melanie | -- | Fidelity National Title Co | |
| Barnett Mary Louise | -- | Fidelity National Title Co | |
| Noble Melanie | -- | -- |
Source: Public Records
Mortgage History
| Date | Status | Borrower | Loan Amount |
|---|---|---|---|
| Previous Owner | Noble Melanie | $270,000 |
Source: Public Records
Tax History
| Year | Tax Paid | Tax Assessment Tax Assessment Total Assessment is a certain percentage of the fair market value that is determined by local assessors to be the total taxable value of land and additions on the property. | Land | Improvement |
|---|---|---|---|---|
| 2025 | $5,161 | $489,989 | $337,729 | $152,260 |
| 2024 | $5,103 | $480,382 | $331,107 | $149,275 |
| 2023 | $5,103 | $470,964 | $324,615 | $146,349 |
| 2022 | $5,016 | $461,730 | $318,250 | $143,480 |
| 2021 | $4,943 | $452,677 | $312,010 | $140,667 |
| 2020 | $4,890 | $448,036 | $308,811 | $139,225 |
| 2019 | $4,794 | $439,252 | $302,756 | $136,496 |
| 2018 | $4,700 | $430,640 | $296,820 | $133,820 |
| 2017 | $1,380 | $119,402 | $37,008 | $82,394 |
| 2016 | $1,352 | $117,062 | $36,283 | $80,779 |
| 2015 | $1,340 | $115,304 | $35,738 | $79,566 |
| 2014 | $1,295 | $113,046 | $35,038 | $78,008 |
Source: Public Records
Map
Nearby Homes
Your Personal Tour Guide
Ask me questions while you tour the home.