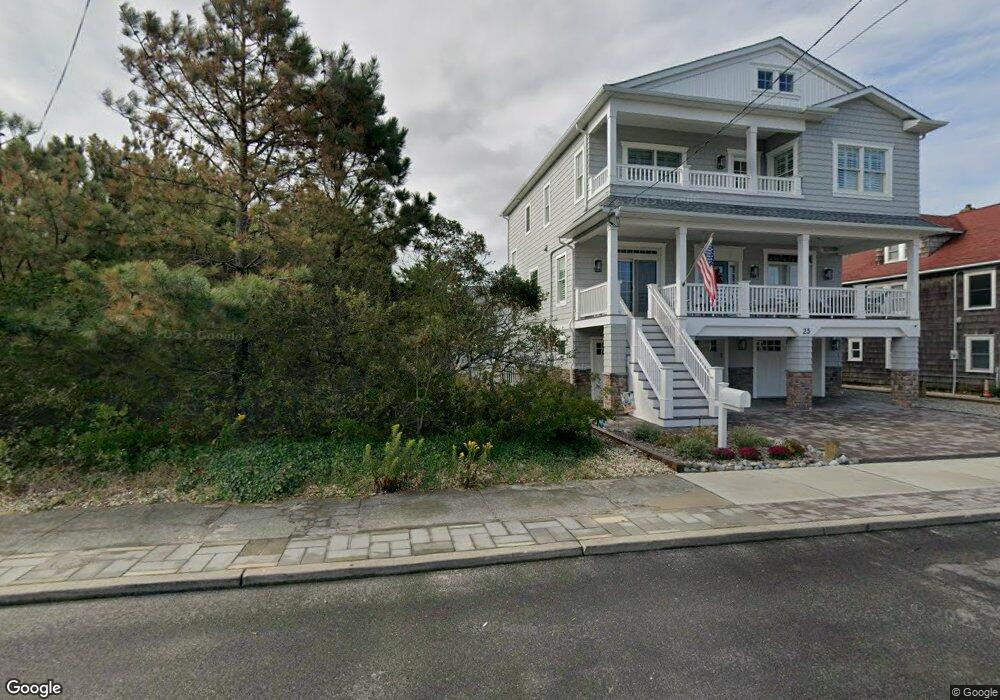
21 2nd Ave Seaside Park, NJ 08752
Estimated Value: $429,000 - $709,000
2
Beds
1
Bath
540
Sq Ft
$1,071/Sq Ft
Est. Value
About This Home
This home is located at 21 2nd Ave, Seaside Park, NJ 08752 and is currently estimated at $578,166, approximately $1,070 per square foot. 21 2nd Ave is a home located in Ocean County with nearby schools including Central Regional Middle School and Central Regional High School.
Ownership History
Date
Name
Owned For
Owner Type
Purchase Details
Closed on
Aug 20, 2021
Sold by
Evans Laurie A and Evans Vincent
Bought by
Spoust Alan and Spoust Barbara
Current Estimated Value
Purchase Details
Closed on
Aug 30, 2012
Sold by
Lombardo Anthony M and Lombardo Paul S
Bought by
Evans Laurie A and Evans Vincent
Home Financials for this Owner
Home Financials are based on the most recent Mortgage that was taken out on this home.
Original Mortgage
$200,000
Interest Rate
3.59%
Mortgage Type
Stand Alone Second
Create a Home Valuation Report for This Property
The Home Valuation Report is an in-depth analysis detailing your home's value as well as a comparison with similar homes in the area
Home Values in the Area
Average Home Value in this Area
Purchase History
| Date | Buyer | Sale Price | Title Company |
|---|---|---|---|
| Spoust Alan | $505,000 | Old Republic Title | |
| Evans Laurie A | $255,000 | First American Title Insuran |
Source: Public Records
Mortgage History
| Date | Status | Borrower | Loan Amount |
|---|---|---|---|
| Previous Owner | Evans Laurie A | $200,000 |
Source: Public Records
Tax History Compared to Growth
Tax History
| Year | Tax Paid | Tax Assessment Tax Assessment Total Assessment is a certain percentage of the fair market value that is determined by local assessors to be the total taxable value of land and additions on the property. | Land | Improvement |
|---|---|---|---|---|
| 2025 | $6,630 | $275,000 | $258,000 | $17,000 |
| 2024 | $6,380 | $275,000 | $258,000 | $17,000 |
| 2023 | $6,262 | $275,000 | $258,000 | $17,000 |
| 2022 | $6,262 | $275,000 | $258,000 | $17,000 |
| 2021 | $6,130 | $275,000 | $258,000 | $17,000 |
| 2020 | $6,130 | $275,000 | $258,000 | $17,000 |
| 2019 | $5,959 | $275,000 | $258,000 | $17,000 |
| 2018 | $5,940 | $275,000 | $258,000 | $17,000 |
| 2017 | $5,720 | $275,000 | $258,000 | $17,000 |
| 2016 | $5,690 | $275,000 | $258,000 | $17,000 |
| 2015 | $5,533 | $275,000 | $258,000 | $17,000 |
| 2014 | $5,376 | $275,000 | $258,000 | $17,000 |
Source: Public Records
Map
Nearby Homes