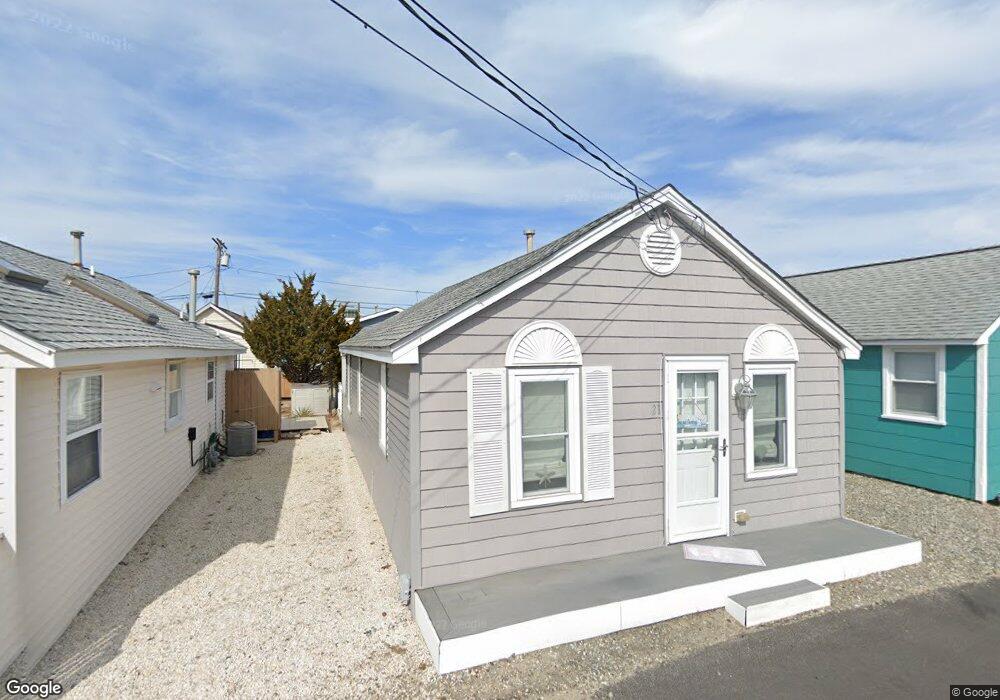
21 5th Ln Unit 142 Seaside Park, NJ 08752
Estimated Value: $495,084 - $631,000
2
Beds
1
Bath
594
Sq Ft
$943/Sq Ft
Est. Value
About This Home
This home is located at 21 5th Ln Unit 142, Seaside Park, NJ 08752 and is currently estimated at $560,021, approximately $942 per square foot. 21 5th Ln Unit 142 is a home located in Ocean County with nearby schools including Central Regional Middle School and Central Regional High School.
Ownership History
Date
Name
Owned For
Owner Type
Purchase Details
Closed on
May 23, 2018
Sold by
Bruno Richard F
Bought by
Bruno Richard and Eileen Bruno
Current Estimated Value
Purchase Details
Closed on
Apr 30, 2012
Sold by
Aer Properties Llc
Bought by
Bruno Richard F
Purchase Details
Closed on
Dec 22, 2006
Sold by
Padian R Bruce
Bought by
Aer Properties Llc
Home Financials for this Owner
Home Financials are based on the most recent Mortgage that was taken out on this home.
Original Mortgage
$230,000
Interest Rate
6.14%
Mortgage Type
Stand Alone First
Create a Home Valuation Report for This Property
The Home Valuation Report is an in-depth analysis detailing your home's value as well as a comparison with similar homes in the area
Home Values in the Area
Average Home Value in this Area
Purchase History
| Date | Buyer | Sale Price | Title Company |
|---|---|---|---|
| Bruno Richard | -- | None Available | |
| Bruno Richard F | -- | None Available | |
| Aer Properties Llc | $380,000 | First American Title Ins Co |
Source: Public Records
Mortgage History
| Date | Status | Borrower | Loan Amount |
|---|---|---|---|
| Previous Owner | Aer Properties Llc | $230,000 |
Source: Public Records
Tax History Compared to Growth
Tax History
| Year | Tax Paid | Tax Assessment Tax Assessment Total Assessment is a certain percentage of the fair market value that is determined by local assessors to be the total taxable value of land and additions on the property. | Land | Improvement |
|---|---|---|---|---|
| 2025 | $6,992 | $290,000 | $248,000 | $42,000 |
| 2024 | $6,728 | $290,000 | $248,000 | $42,000 |
| 2023 | $6,603 | $290,000 | $248,000 | $42,000 |
| 2022 | $6,603 | $290,000 | $248,000 | $42,000 |
| 2021 | $6,464 | $290,000 | $248,000 | $42,000 |
| 2020 | $6,464 | $290,000 | $248,000 | $42,000 |
| 2019 | $6,284 | $290,000 | $248,000 | $42,000 |
| 2018 | $6,264 | $290,000 | $248,000 | $42,000 |
| 2017 | $6,240 | $300,000 | $258,000 | $42,000 |
| 2016 | $6,207 | $300,000 | $258,000 | $42,000 |
| 2015 | $6,036 | $300,000 | $258,000 | $42,000 |
| 2014 | $5,865 | $300,000 | $258,000 | $42,000 |
Source: Public Records
Map
Nearby Homes