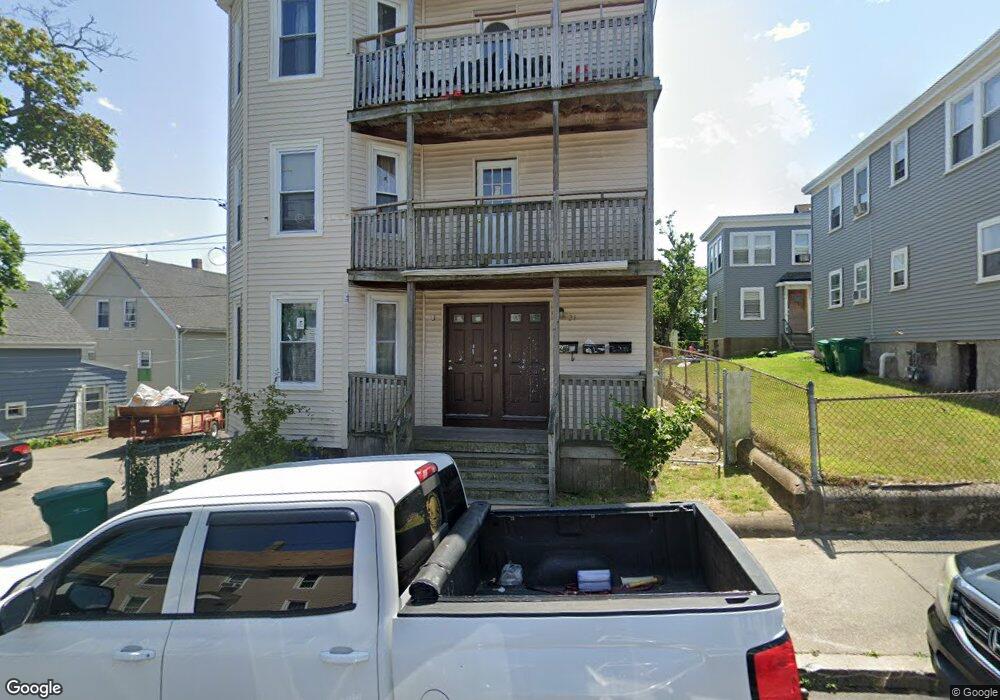
21 Acorn St Unit 23 Lynn, MA 01902
Highlands NeighborhoodEstimated Value: $698,000 - $989,000
6
Beds
3
Baths
3,735
Sq Ft
$232/Sq Ft
Est. Value
About This Home
This home is located at 21 Acorn St Unit 23, Lynn, MA 01902 and is currently estimated at $866,333, approximately $231 per square foot. 21 Acorn St Unit 23 is a home located in Essex County with nearby schools including Robert L. Ford Elementary School, William R. Fallon School, and Fecteau-Leary Junior/Senior High School.
Ownership History
Date
Name
Owned For
Owner Type
Purchase Details
Closed on
Nov 23, 2021
Sold by
Ung Meng
Bought by
Ung Cheng S and Ung Meng I
Current Estimated Value
Home Financials for this Owner
Home Financials are based on the most recent Mortgage that was taken out on this home.
Original Mortgage
$1,687,000
Outstanding Balance
$1,549,041
Interest Rate
3.14%
Mortgage Type
New Conventional
Estimated Equity
-$682,708
Purchase Details
Closed on
Mar 18, 1996
Sold by
Century B&T Co
Bought by
Ung Meng
Home Financials for this Owner
Home Financials are based on the most recent Mortgage that was taken out on this home.
Original Mortgage
$59,850
Interest Rate
6.97%
Mortgage Type
Purchase Money Mortgage
Purchase Details
Closed on
Nov 13, 1995
Sold by
Powers Thomas A
Bought by
Century B&T Co
Create a Home Valuation Report for This Property
The Home Valuation Report is an in-depth analysis detailing your home's value as well as a comparison with similar homes in the area
Home Values in the Area
Average Home Value in this Area
Purchase History
| Date | Buyer | Sale Price | Title Company |
|---|---|---|---|
| Ung Cheng S | -- | None Available | |
| Ung Cheng S | -- | None Available | |
| Ung Meng | $52,500 | -- | |
| Ung Meng | $52,500 | -- | |
| Century B&T Co | $25,000 | -- | |
| Century B & T Co | $25,000 | -- |
Source: Public Records
Mortgage History
| Date | Status | Borrower | Loan Amount |
|---|---|---|---|
| Open | Ung Cheng S | $1,687,000 | |
| Closed | Ung Cheng S | $1,687,000 | |
| Previous Owner | Century B & T Co | $1,300,000 | |
| Previous Owner | Century B & T Co | $100,000 | |
| Previous Owner | Century B & T Co | $59,850 |
Source: Public Records
Tax History Compared to Growth
Tax History
| Year | Tax Paid | Tax Assessment Tax Assessment Total Assessment is a certain percentage of the fair market value that is determined by local assessors to be the total taxable value of land and additions on the property. | Land | Improvement |
|---|---|---|---|---|
| 2025 | $8,291 | $800,300 | $195,600 | $604,700 |
| 2024 | $8,154 | $774,400 | $176,500 | $597,900 |
| 2023 | $7,906 | $709,100 | $176,500 | $532,600 |
| 2022 | $7,702 | $619,600 | $144,400 | $475,200 |
| 2021 | $7,341 | $563,400 | $131,700 | $431,700 |
| 2020 | $6,685 | $498,900 | $102,900 | $396,000 |
| 2019 | $6,547 | $457,800 | $100,300 | $357,500 |
| 2018 | $6,040 | $398,700 | $97,000 | $301,700 |
| 2017 | $5,602 | $359,100 | $75,400 | $283,700 |
| 2016 | $5,113 | $316,000 | $63,500 | $252,500 |
| 2015 | $4,737 | $282,800 | $68,200 | $214,600 |
Source: Public Records
Map
Nearby Homes
- 16 Hollingsworth St
- 440 Essex St
- 0 High St
- 14 Mount Pleasant Place
- 199 Allen Ave
- 69 Hawthorne St
- 6-8 Beede Ave
- 105 Lawton Ave
- 94 Sheridan St
- 191-193 Washington St
- 30 Adams St
- 344 Essex St
- 5 Whittier St
- 589 Essex St Unit 102
- 374-378 Washington St
- 42 Joyce St Unit H
- 13 Willow St Unit 206
- 57 Johnson St
- 58 Laighton St
- 12 Chestnut Ave