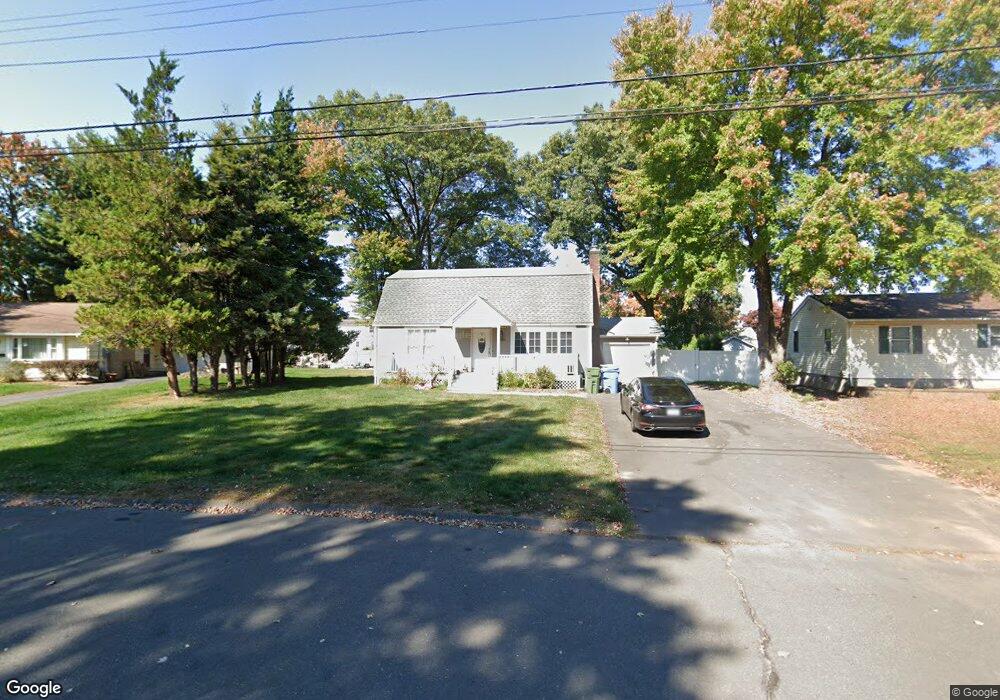
21 Arlene Dr Bristol, CT 06010
Forestville NeighborhoodEstimated Value: $341,000 - $387,000
4
Beds
2
Baths
1,685
Sq Ft
$219/Sq Ft
Est. Value
About This Home
This home is located at 21 Arlene Dr, Bristol, CT 06010 and is currently estimated at $369,203, approximately $219 per square foot. 21 Arlene Dr is a home located in Hartford County with nearby schools including Stafford School, Chippens Hill Middle School, and Bristol Eastern High School.
Ownership History
Date
Name
Owned For
Owner Type
Purchase Details
Closed on
Jul 30, 2024
Sold by
Payton Investments Llc
Bought by
Lafayette Mark and Lafayette Ashley
Current Estimated Value
Purchase Details
Closed on
Mar 26, 2023
Sold by
Lafayette Mark and Lafayette Ashley
Bought by
Payton Investments Llc
Purchase Details
Closed on
Oct 1, 2018
Sold by
Deutsche Bank Natl T C
Bought by
Zera Zbigniew
Home Financials for this Owner
Home Financials are based on the most recent Mortgage that was taken out on this home.
Original Mortgage
$99,000
Interest Rate
4.5%
Mortgage Type
Purchase Money Mortgage
Purchase Details
Closed on
Oct 25, 2017
Sold by
Cuomo Adam J
Bought by
Deutsche Bk Natl T Co
Purchase Details
Closed on
Mar 24, 2005
Sold by
Kavalauskas Stephen A and Kavalauskas Theresa B
Bought by
Cuomo Adam J
Create a Home Valuation Report for This Property
The Home Valuation Report is an in-depth analysis detailing your home's value as well as a comparison with similar homes in the area
Home Values in the Area
Average Home Value in this Area
Purchase History
| Date | Buyer | Sale Price | Title Company |
|---|---|---|---|
| Lafayette Mark | -- | None Available | |
| Lafayette Mark | -- | None Available | |
| Payton Investments Llc | -- | None Available | |
| Payton Investments Llc | -- | None Available | |
| Zera Zbigniew | $97,577 | -- | |
| Deutsche Bk Natl T Co | -- | -- | |
| Cuomo Adam J | $205,000 | -- | |
| Zera Zbigniew | $97,577 | -- | |
| Deutsche Bk Natl T Co | -- | -- | |
| Cuomo Adam J | $205,000 | -- |
Source: Public Records
Mortgage History
| Date | Status | Borrower | Loan Amount |
|---|---|---|---|
| Previous Owner | Cuomo Adam J | $99,000 |
Source: Public Records
Tax History
| Year | Tax Paid | Tax Assessment Tax Assessment Total Assessment is a certain percentage of the fair market value that is determined by local assessors to be the total taxable value of land and additions on the property. | Land | Improvement |
|---|---|---|---|---|
| 2025 | $6,487 | $192,220 | $49,770 | $142,450 |
| 2024 | $6,107 | $191,730 | $49,770 | $141,960 |
| 2023 | $5,819 | $191,730 | $49,770 | $141,960 |
| 2022 | $4,950 | $129,080 | $34,580 | $94,500 |
| 2021 | $4,950 | $129,080 | $34,580 | $94,500 |
| 2020 | $4,950 | $129,080 | $34,580 | $94,500 |
| 2019 | $4,911 | $129,080 | $34,580 | $94,500 |
| 2018 | $4,760 | $129,080 | $34,580 | $94,500 |
| 2017 | $4,651 | $129,080 | $49,420 | $79,660 |
| 2016 | $4,651 | $129,080 | $49,420 | $79,660 |
| 2015 | $4,467 | $129,080 | $49,420 | $79,660 |
| 2014 | $4,467 | $129,080 | $49,420 | $79,660 |
Source: Public Records
Map
Nearby Homes
- 225 Stonecrest Dr
- 115 Daniel Rd
- 92 Garfield Rd
- 156 New St
- 175 Moody St
- 30 Adeline Ave
- 64 Fanway Ave
- 64 4th St
- 524 Broad St
- 1 Hickory St
- 220 Blakeslee St Unit 220
- 62 Chatham Ln
- 135 Jerome Ave
- 101 Vincent Rd
- 169 Morningside Dr E
- 35 Broadview St
- 20 Westchester Dr
- 0 Fairlawn St
- 44 Curtiss Ave
- 941 Farmington Ave
Your Personal Tour Guide
Ask me questions while you tour the home.