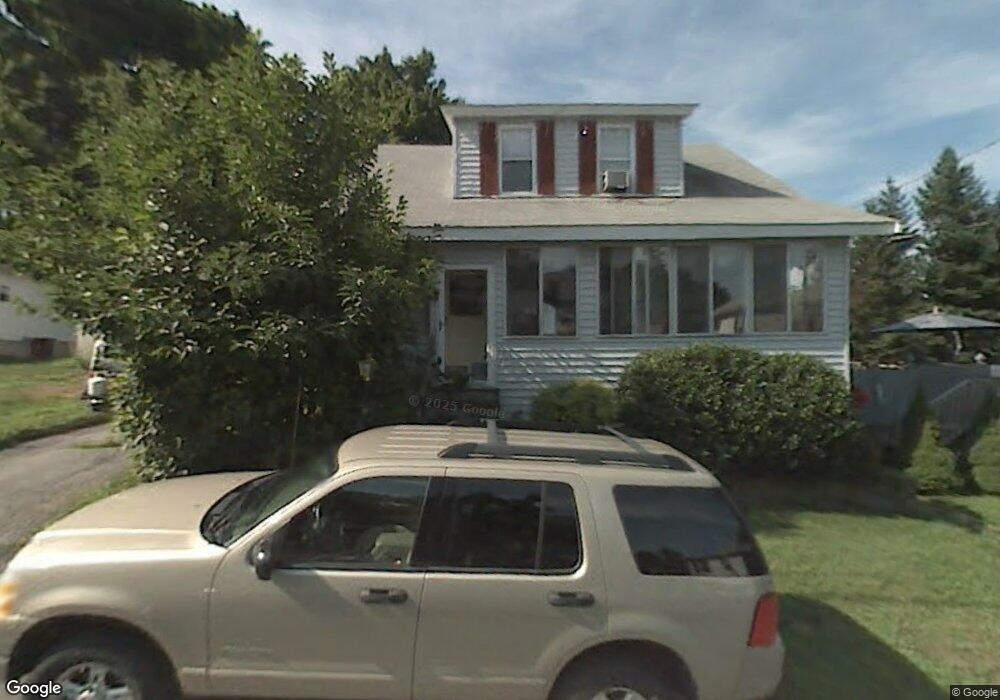
21 Arthur St Clinton, MA 01510
Estimated Value: $369,000 - $418,000
3
Beds
2
Baths
1,254
Sq Ft
$310/Sq Ft
Est. Value
About This Home
This home is located at 21 Arthur St, Clinton, MA 01510 and is currently estimated at $388,648, approximately $309 per square foot. 21 Arthur St is a home located in Worcester County with nearby schools including Clinton Elementary School, Clinton Senior High School, and Clinton Middle School.
Ownership History
Date
Name
Owned For
Owner Type
Purchase Details
Closed on
Dec 11, 2019
Sold by
Gomez Ellen M
Bought by
Gomez Ellen M and Gomez Alejandro R
Current Estimated Value
Purchase Details
Closed on
Feb 13, 1984
Bought by
Gordon Ellen M
Create a Home Valuation Report for This Property
The Home Valuation Report is an in-depth analysis detailing your home's value as well as a comparison with similar homes in the area
Home Values in the Area
Average Home Value in this Area
Purchase History
| Date | Buyer | Sale Price | Title Company |
|---|---|---|---|
| Gomez Ellen M | -- | None Available | |
| Gordon Ellen M | -- | -- |
Source: Public Records
Mortgage History
| Date | Status | Borrower | Loan Amount |
|---|---|---|---|
| Previous Owner | Gordon Ellen M | $64,800 | |
| Previous Owner | Gordon Ellen M | $25,000 | |
| Previous Owner | Gordon Ellen M | $58,000 | |
| Previous Owner | Gordon Ellen M | $38,000 |
Source: Public Records
Tax History Compared to Growth
Tax History
| Year | Tax Paid | Tax Assessment Tax Assessment Total Assessment is a certain percentage of the fair market value that is determined by local assessors to be the total taxable value of land and additions on the property. | Land | Improvement |
|---|---|---|---|---|
| 2025 | $4,380 | $329,300 | $99,100 | $230,200 |
| 2024 | $4,146 | $315,500 | $99,100 | $216,400 |
| 2023 | $3,883 | $290,400 | $90,100 | $200,300 |
| 2022 | $3,866 | $259,300 | $81,900 | $177,400 |
| 2021 | $3,484 | $218,600 | $78,000 | $140,600 |
| 2020 | $3,386 | $218,600 | $78,000 | $140,600 |
| 2019 | $3,204 | $201,100 | $75,700 | $125,400 |
| 2018 | $3,350 | $197,300 | $75,700 | $121,600 |
| 2017 | $3,006 | $170,100 | $75,700 | $94,400 |
| 2016 | $2,984 | $172,800 | $75,700 | $97,100 |
| 2015 | $2,762 | $165,800 | $73,500 | $92,300 |
| 2014 | $2,678 | $165,800 | $73,500 | $92,300 |
Source: Public Records
Map
Nearby Homes
- 284 Main St
- 13 Simon Ct
- 403 Main St
- 160 Park St
- 131 Main St
- 38 Norman St
- 125 Grove St
- 180 Beacon St
- 40 Nashua St Unit 5
- 37 Grove St Unit 37
- 286 Grove St
- 286 Grove St Unit 286
- 18 Eagle Nest Unit 331
- 70 Oak St Unit 70
- 78 Oak St Unit 78
- 109 Oak St
- 89 1/2 Walnut St
- 55 Sterling St Unit 306
- 55 Sterling St Unit 314
- 19 Sprague Rd