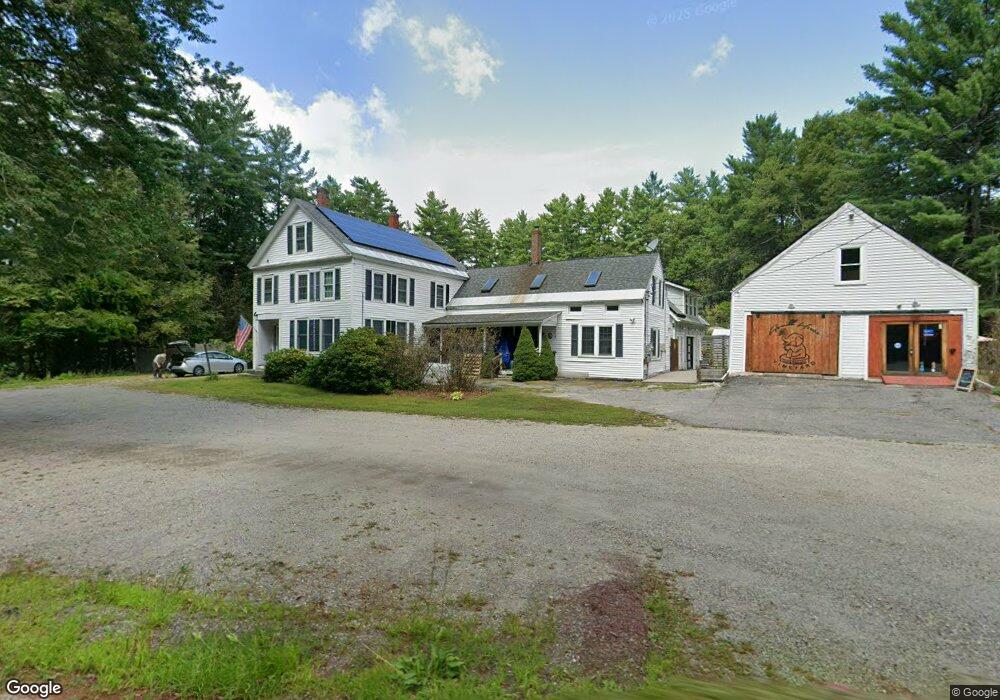
21 Averill Rd Brookline, NH 03033
Estimated Value: $649,530 - $781,000
4
Beds
3
Baths
2,943
Sq Ft
$232/Sq Ft
Est. Value
About This Home
This home is located at 21 Averill Rd, Brookline, NH 03033 and is currently estimated at $683,883, approximately $232 per square foot. 21 Averill Rd is a home with nearby schools including Richard Maghakian Memorial School, Captain Samuel Douglass Academy, and Hollis-Brookline Middle School.
Ownership History
Date
Name
Owned For
Owner Type
Purchase Details
Closed on
Sep 2, 2003
Sold by
Hill Susan N
Bought by
Waite Robert and Waite Kathi
Current Estimated Value
Purchase Details
Closed on
Jul 5, 2001
Sold by
Higgins Robert W and Higgins Barbara J
Bought by
Hill Susan N
Create a Home Valuation Report for This Property
The Home Valuation Report is an in-depth analysis detailing your home's value as well as a comparison with similar homes in the area
Home Values in the Area
Average Home Value in this Area
Purchase History
| Date | Buyer | Sale Price | Title Company |
|---|---|---|---|
| Waite Robert | $308,000 | -- | |
| Hill Susan N | $245,000 | -- |
Source: Public Records
Mortgage History
| Date | Status | Borrower | Loan Amount |
|---|---|---|---|
| Open | Hill Susan N | $291,914 | |
| Closed | Hill Susan N | $266,300 | |
| Closed | Hill Susan N | $45,000 |
Source: Public Records
Tax History Compared to Growth
Tax History
| Year | Tax Paid | Tax Assessment Tax Assessment Total Assessment is a certain percentage of the fair market value that is determined by local assessors to be the total taxable value of land and additions on the property. | Land | Improvement |
|---|---|---|---|---|
| 2024 | $13,464 | $595,500 | $209,100 | $386,400 |
| 2023 | $11,940 | $574,600 | $209,100 | $365,500 |
| 2022 | $11,799 | $397,000 | $122,500 | $274,500 |
| 2021 | $11,012 | $385,300 | $122,500 | $262,800 |
| 2020 | $10,675 | $384,000 | $122,500 | $261,500 |
| 2019 | $11,470 | $384,000 | $122,500 | $261,500 |
| 2018 | $11,115 | $376,000 | $122,500 | $253,500 |
| 2017 | $9,095 | $276,100 | $97,100 | $179,000 |
| 2016 | $8,882 | $272,800 | $97,200 | $175,600 |
| 2015 | $8,470 | $272,800 | $97,200 | $175,600 |
| 2014 | $8,961 | $272,800 | $97,200 | $175,600 |
Source: Public Records
Map
Nearby Homes
- 15 N End Rd
- 364 Townsend Hill Rd
- 7 Winterberry Rd
- 9 Winterberry Rd
- 55 Oak Hill Rd
- 46 Oak Hill Rd
- 6 High Oaks Path
- 0 Brookline St
- 64 Meadow Rd
- 6 Flint Meadow Dr
- 21 Cranberry St
- 22 Hobart Hill Rd
- 167 Route 13
- 1235 Townsend Rd
- 110 Haynes Rd
- 28A Rocky Pond Rd
- 91 Highland St
- 75 Highland St
- 5 Carons Way
- 10 Stearns Ave