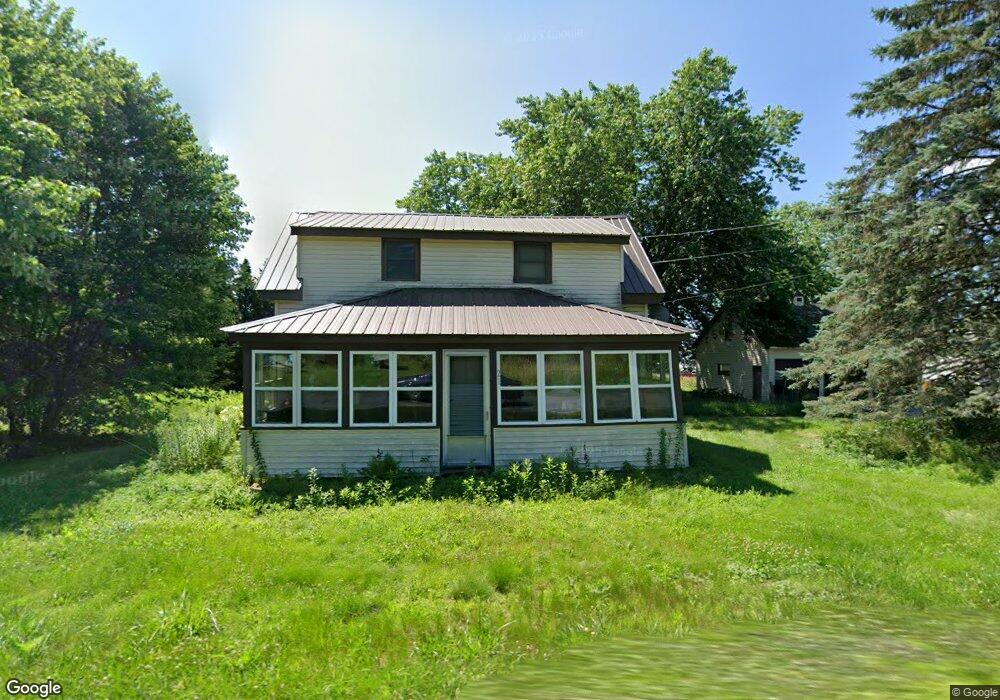
21 Barber Rd Randolph, ME 04346
Estimated Value: $252,000 - $345,000
About This Home
This home is located at 21 Barber Rd, Randolph, ME 04346 and is currently estimated at $295,135, approximately $210 per square foot. 21 Barber Rd is a home located in Kennebec County with nearby schools including Gardiner Area High School and Spurwink School - Chelsea.
Ownership History
We collect this data history from publicly available records. To have your information removed, we recommend requesting removal directly through your county’s website.
Purchase Details
Home Financials for this Owner
Home Financials are based on the most recent Mortgage that was taken out on this home.Purchase Details
Home Financials for this Owner
Home Financials are based on the most recent Mortgage that was taken out on this home.Purchase Details
Home Financials for this Owner
Home Financials are based on the most recent Mortgage that was taken out on this home.Home Values in the Area
Average Home Value in this Area
Purchase History
We collect this data history from publicly available records. To have your information removed, we recommend requesting removal directly through your county’s website.
| Date | Buyer | Sale Price | Title Company |
|---|---|---|---|
| -- | None Available | ||
| -- | None Available | ||
| -- | -- |
Mortgage History
We collect this data history from publicly available records. To have your information removed, we recommend requesting removal directly through your county’s website.
| Date | Status | Borrower | Loan Amount |
|---|---|---|---|
| Open | $108,872 | ||
| Previous Owner | $125,000 |
Tax History
We collect this data history from publicly available records. To have your information removed, we recommend requesting removal directly through your county’s website.
| Year | Tax Paid | Tax Assessment Tax Assessment Total Assessment is a certain percentage of the fair market value that is determined by local assessors to be the total taxable value of land and additions on the property. | Land | Improvement |
|---|---|---|---|---|
| 2025 | $3,676 | $266,400 | $37,100 | $229,300 |
| 2024 | $3,610 | $234,400 | $35,300 | $199,100 |
| 2023 | $3,181 | $182,800 | $35,300 | $147,500 |
| 2022 | $3,290 | $182,800 | $35,300 | $147,500 |
| 2021 | $3,162 | $182,800 | $35,300 | $147,500 |
| 2020 | $3,108 | $182,800 | $35,300 | $147,500 |
| 2019 | $2,374 | $129,000 | $35,300 | $93,700 |
| 2018 | $2,374 | $129,000 | $35,300 | $93,700 |
| 2017 | $2,374 | $129,000 | $35,300 | $93,700 |
| 2016 | $2,374 | $129,000 | $35,300 | $93,700 |
| 2015 | $2,322 | $129,000 | $35,300 | $93,700 |
| 2014 | $2,264 | $129,000 | $35,300 | $93,700 |
| 2013 | $2,099 | $131,200 | $35,300 | $95,900 |
Map
- 326 Windsor St
- 263 Windsor St
- 218 Windsor St
- 208 Windsor St
- 154 Barber Rd
- 23 Brookview Dr
- 16 Steepleview Ct
- 140 Togus Rd
- 73 Kinderhook St
- 154 Togus Rd
- 47 Hideaway Acres Rd
- 296 Water St
- 27 Windsor St
- 26 Clark St
- 48 Hemlock Ridge Rd
- 8 Maple St
- 6 Jones St
- 1090 Pittston School St
- 500 Whitefield Rd
- 511 Whitefield Rd
Ask me questions while you tour the home.