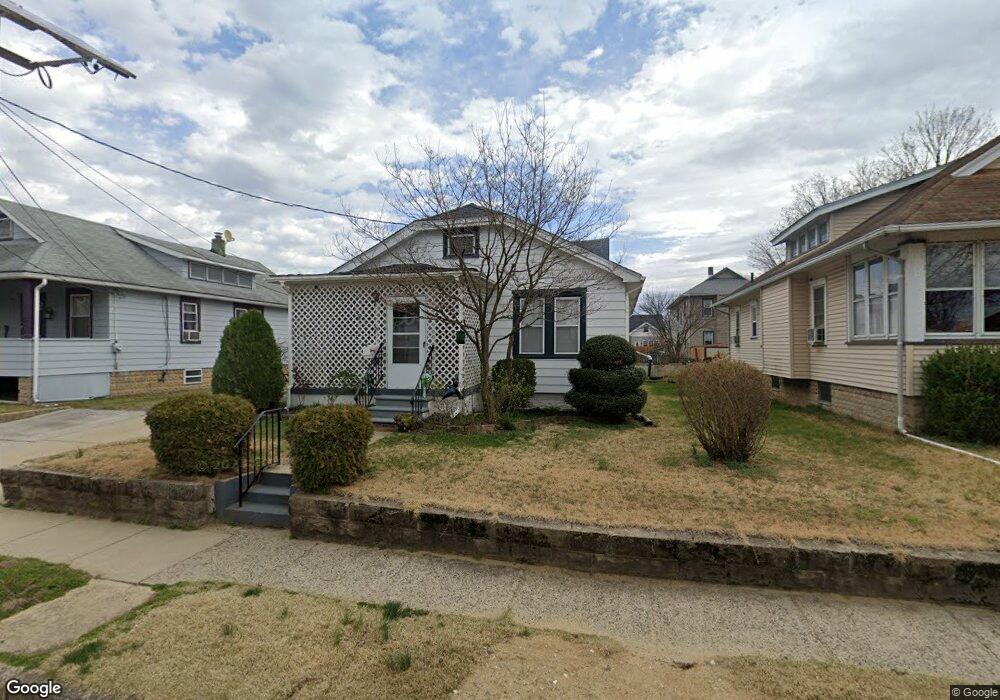
21 Barnard Ave Gloucester City, NJ 08030
Estimated Value: $205,235 - $229,000
Studio
--
Bath
988
Sq Ft
$220/Sq Ft
Est. Value
About This Home
This home is located at 21 Barnard Ave, Gloucester City, NJ 08030 and is currently estimated at $217,059, approximately $219 per square foot. 21 Barnard Ave is a home located in Camden County with nearby schools including Cold Springs School, Gloucester City Middle School, and Gloucester City Junior/Senior High School.
Ownership History
Date
Name
Owned For
Owner Type
Purchase Details
Closed on
Jul 19, 2019
Sold by
Mtglq Investors Lp
Bought by
52 Benefits Trust
Current Estimated Value
Purchase Details
Closed on
Nov 30, 2018
Sold by
Malone Samuel J and Gatta William J
Bought by
Mtglq Investors Lp
Purchase Details
Closed on
Mar 2, 1999
Sold by
Wilson Delores R
Bought by
Reader Daniel E and Reader Theresa A
Home Financials for this Owner
Home Financials are based on the most recent Mortgage that was taken out on this home.
Original Mortgage
$58,900
Interest Rate
6.73%
Create a Home Valuation Report for This Property
The Home Valuation Report is an in-depth analysis detailing your home's value as well as a comparison with similar homes in the area
Home Values in the Area
Average Home Value in this Area
Purchase History
| Date | Buyer | Sale Price | Title Company |
|---|---|---|---|
| 52 Benefits Trust | $179,500 | Fidelity National Agency Sln | |
| Mtglq Investors Lp | -- | None Available | |
| Reader Daniel E | $62,000 | -- |
Source: Public Records
Mortgage History
| Date | Status | Borrower | Loan Amount |
|---|---|---|---|
| Previous Owner | Reader Daniel E | $58,900 |
Source: Public Records
Tax History
| Year | Tax Paid | Tax Assessment Tax Assessment Total Assessment is a certain percentage of the fair market value that is determined by local assessors to be the total taxable value of land and additions on the property. | Land | Improvement |
|---|---|---|---|---|
| 2025 | $5,203 | $103,800 | $35,000 | $68,800 |
| 2024 | $5,194 | $103,800 | $35,000 | $68,800 |
| 2023 | $5,194 | $103,800 | $35,000 | $68,800 |
| 2022 | $4,884 | $103,800 | $35,000 | $68,800 |
| 2021 | $4,835 | $103,800 | $35,000 | $68,800 |
| 2020 | $4,669 | $103,800 | $35,000 | $68,800 |
| 2019 | $4,573 | $103,800 | $35,000 | $68,800 |
| 2018 | $4,484 | $103,800 | $35,000 | $68,800 |
| 2017 | $4,392 | $103,800 | $35,000 | $68,800 |
| 2016 | $4,226 | $103,800 | $35,000 | $68,800 |
| 2015 | $3,805 | $103,800 | $35,000 | $68,800 |
| 2014 | $3,730 | $71,100 | $18,500 | $52,600 |
Source: Public Records
Map
Nearby Homes
Your Personal Tour Guide
Ask me questions while you tour the home.