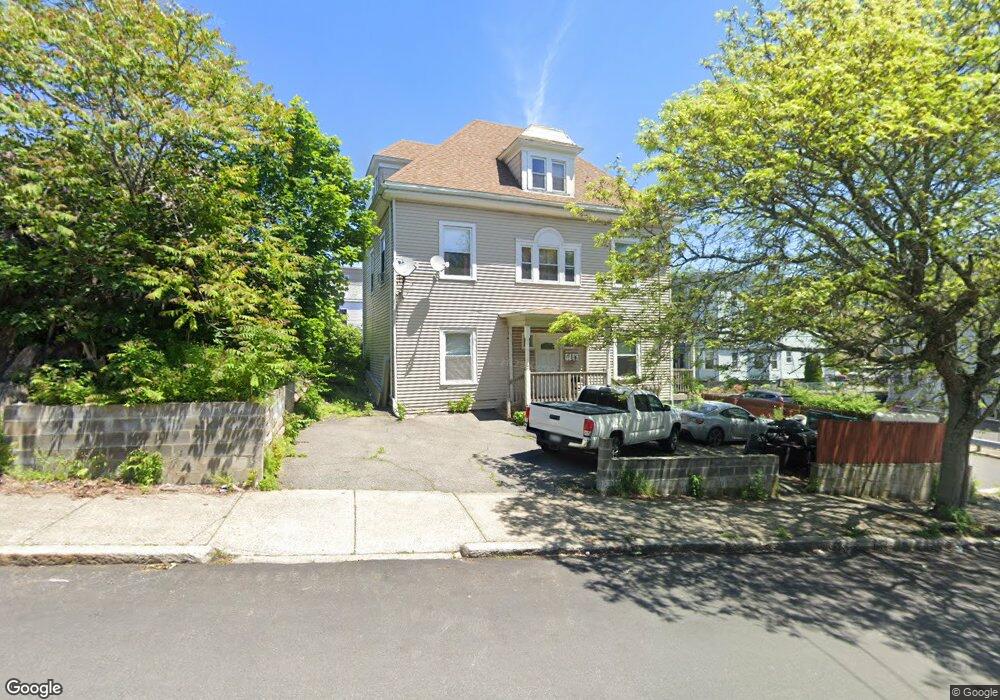
21 Bay View Ave Lynn, MA 01902
Highlands NeighborhoodEstimated Value: $890,000 - $975,000
9
Beds
3
Baths
3,655
Sq Ft
$255/Sq Ft
Est. Value
About This Home
This home is located at 21 Bay View Ave, Lynn, MA 01902 and is currently estimated at $931,000, approximately $254 per square foot. 21 Bay View Ave is a home located in Essex County with nearby schools including Cobbet Elementary School, William R. Fallon School, and Fecteau-Leary Junior/Senior High School.
Ownership History
Date
Name
Owned For
Owner Type
Purchase Details
Closed on
Jun 5, 2015
Sold by
Uk Sunnarith and Uk Sunnary
Bought by
Nop Reasey and Uk Sunnarith S
Current Estimated Value
Home Financials for this Owner
Home Financials are based on the most recent Mortgage that was taken out on this home.
Original Mortgage
$280,200
Interest Rate
3.62%
Mortgage Type
New Conventional
Purchase Details
Closed on
Feb 19, 2004
Sold by
Uk Sunnarith
Bought by
Uk Sunnarith
Purchase Details
Closed on
Aug 12, 1996
Sold by
Thongsavath Bounkong and Thongsavath Soutane
Bought by
Uk Sunnarith and Kou Ol
Home Financials for this Owner
Home Financials are based on the most recent Mortgage that was taken out on this home.
Original Mortgage
$35,100
Interest Rate
8.24%
Mortgage Type
Purchase Money Mortgage
Purchase Details
Closed on
Apr 7, 1993
Sold by
Meridian Mtg Corp
Bought by
Thongsavath Bounkong
Purchase Details
Closed on
Aug 4, 1992
Sold by
Lessard Lawrence A
Bought by
Federal National Mortgage Association
Create a Home Valuation Report for This Property
The Home Valuation Report is an in-depth analysis detailing your home's value as well as a comparison with similar homes in the area
Home Values in the Area
Average Home Value in this Area
Purchase History
| Date | Buyer | Sale Price | Title Company |
|---|---|---|---|
| Nop Reasey | -- | -- | |
| Nop Reasey | -- | -- | |
| Uk Sunnarith | -- | -- | |
| Uk Sunnarith | -- | -- | |
| Uk Sunnarith | $39,000 | -- | |
| Uk Sunnarith | $39,000 | -- | |
| Thongsavath Bounkong | $48,000 | -- | |
| Thongsavath Bounkong | $48,000 | -- | |
| Federal National Mortgage Association | $122,500 | -- | |
| Federal National Mortgage Association | $122,500 | -- |
Source: Public Records
Mortgage History
| Date | Status | Borrower | Loan Amount |
|---|---|---|---|
| Closed | Nop Reasey | $280,200 | |
| Previous Owner | Federal National Mortgage Association | $201,000 | |
| Previous Owner | Federal National Mortgage Association | $35,100 |
Source: Public Records
Tax History
| Year | Tax Paid | Tax Assessment Tax Assessment Total Assessment is a certain percentage of the fair market value that is determined by local assessors to be the total taxable value of land and additions on the property. | Land | Improvement |
|---|---|---|---|---|
| 2025 | $9,711 | $937,400 | $199,800 | $737,600 |
| 2024 | $9,578 | $909,600 | $180,300 | $729,300 |
| 2023 | $9,255 | $830,000 | $180,300 | $649,700 |
| 2022 | $9,037 | $727,000 | $147,400 | $579,600 |
| 2021 | $8,613 | $661,000 | $134,500 | $526,500 |
| 2020 | $7,879 | $588,000 | $105,100 | $482,900 |
| 2019 | $7,699 | $538,400 | $102,500 | $435,900 |
| 2018 | $7,074 | $466,900 | $99,000 | $367,900 |
| 2017 | $6,837 | $438,300 | $77,000 | $361,300 |
| 2016 | $6,247 | $386,100 | $64,900 | $321,200 |
| 2015 | -- | $342,200 | $69,600 | $272,600 |
Source: Public Records
Map
Nearby Homes
- 69 Hollingsworth St Unit 69A
- 67 Beacon Hill Ave
- 102 Rockaway St
- 14 Valley Ave
- 10 Valley Ave
- 199 Allen Ave
- 6-8 Beede Ave
- 70 Grant St
- 15 Nichols Ave
- 105 Lawton Ave
- 102 Henry Ave
- 49 Eade St
- 25 Hamilton Ave
- 325 Western Ave
- 31 Jefferson St
- 45 Henry Ave
- 406 Chestnut St
- 24 Lily St
- 191-193 Washington St
- 200 Locust St Unit 302
- 142 Hamilton Ave
- 27 Bay View Ave
- 146 Hamilton Ave Unit 148
- 33 Bay View Ave
- 128 Hamilton Ave Unit 130
- 139 Hamilton Ave
- 124 Hamilton Ave Unit 126
- 150 Hamilton Ave Unit 152
- 28 Bay View Ave
- 152 Hamilton Ave
- 11 Bay View Ave
- 11 Bay View Ave Unit 3
- 30 Bay View Ave
- 127 Hamilton Ave Unit 3
- 127 Hamilton Ave
- 143 Hamilton Ave
- 12 Bay View Ave
- 37 Bay View Ave
- 120 Hamilton Ave
- 156 Hamilton Ave
Your Personal Tour Guide
Ask me questions while you tour the home.