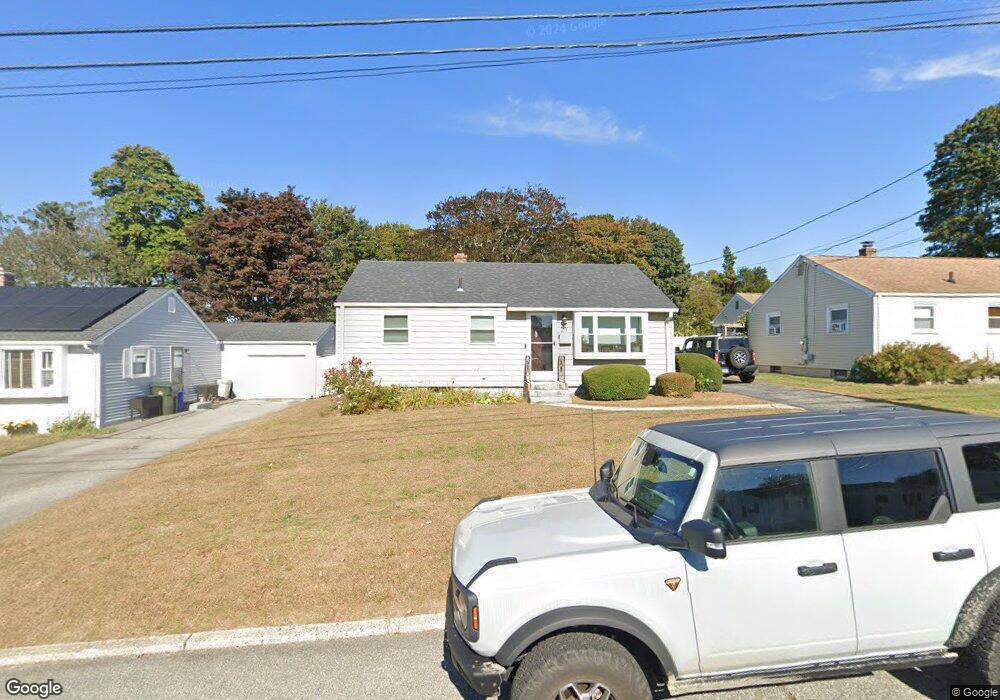
21 Bayshore Dr New London, CT 06320
South New London NeighborhoodEstimated Value: $356,819 - $398,000
2
Beds
1
Bath
900
Sq Ft
$412/Sq Ft
Est. Value
About This Home
This home is located at 21 Bayshore Dr, New London, CT 06320 and is currently estimated at $370,455, approximately $411 per square foot. 21 Bayshore Dr is a home located in New London County with nearby schools including Harbor Elementary School, Bennie Dover Jackson Middle School, and New London High School.
Ownership History
Date
Name
Owned For
Owner Type
Purchase Details
Closed on
Dec 9, 2016
Sold by
Coughlin Michael
Bought by
Coughlin Dean J
Current Estimated Value
Home Financials for this Owner
Home Financials are based on the most recent Mortgage that was taken out on this home.
Original Mortgage
$142,590
Outstanding Balance
$114,961
Interest Rate
3.47%
Mortgage Type
Purchase Money Mortgage
Estimated Equity
$255,494
Purchase Details
Closed on
Sep 1, 2009
Sold by
Hsbc Bank Usa
Bought by
Coughlin Michael
Purchase Details
Closed on
Sep 30, 2005
Sold by
Tewksbury Mary
Bought by
Rudne Jack
Create a Home Valuation Report for This Property
The Home Valuation Report is an in-depth analysis detailing your home's value as well as a comparison with similar homes in the area
Home Values in the Area
Average Home Value in this Area
Purchase History
| Date | Buyer | Sale Price | Title Company |
|---|---|---|---|
| Coughlin Dean J | $147,000 | -- | |
| Coughlin Dean J | $147,000 | -- | |
| Coughlin Michael | $135,000 | -- | |
| Coughlin Michael | $135,000 | -- | |
| Rudne Jack | $175,000 | -- | |
| Rudne Jack | $175,000 | -- |
Source: Public Records
Mortgage History
| Date | Status | Borrower | Loan Amount |
|---|---|---|---|
| Open | Rudne Jack | $142,590 | |
| Closed | Rudne Jack | $9,200 |
Source: Public Records
Tax History Compared to Growth
Tax History
| Year | Tax Paid | Tax Assessment Tax Assessment Total Assessment is a certain percentage of the fair market value that is determined by local assessors to be the total taxable value of land and additions on the property. | Land | Improvement |
|---|---|---|---|---|
| 2025 | $4,940 | $181,600 | $86,500 | $95,100 |
| 2024 | $4,994 | $181,600 | $86,500 | $95,100 |
| 2023 | $4,106 | $110,250 | $64,190 | $46,060 |
| 2022 | $4,035 | $108,150 | $64,190 | $43,960 |
| 2021 | $4,104 | $108,150 | $64,190 | $43,960 |
| 2020 | $4,130 | $108,150 | $64,190 | $43,960 |
| 2019 | $4,315 | $108,150 | $64,190 | $43,960 |
| 2018 | $4,268 | $97,580 | $56,630 | $40,950 |
| 2017 | $4,319 | $97,580 | $56,630 | $40,950 |
| 2016 | $3,948 | $97,580 | $56,630 | $40,950 |
| 2015 | $3,853 | $97,580 | $56,630 | $40,950 |
| 2014 | $3,344 | $97,580 | $56,630 | $40,950 |
Source: Public Records
Map
Nearby Homes