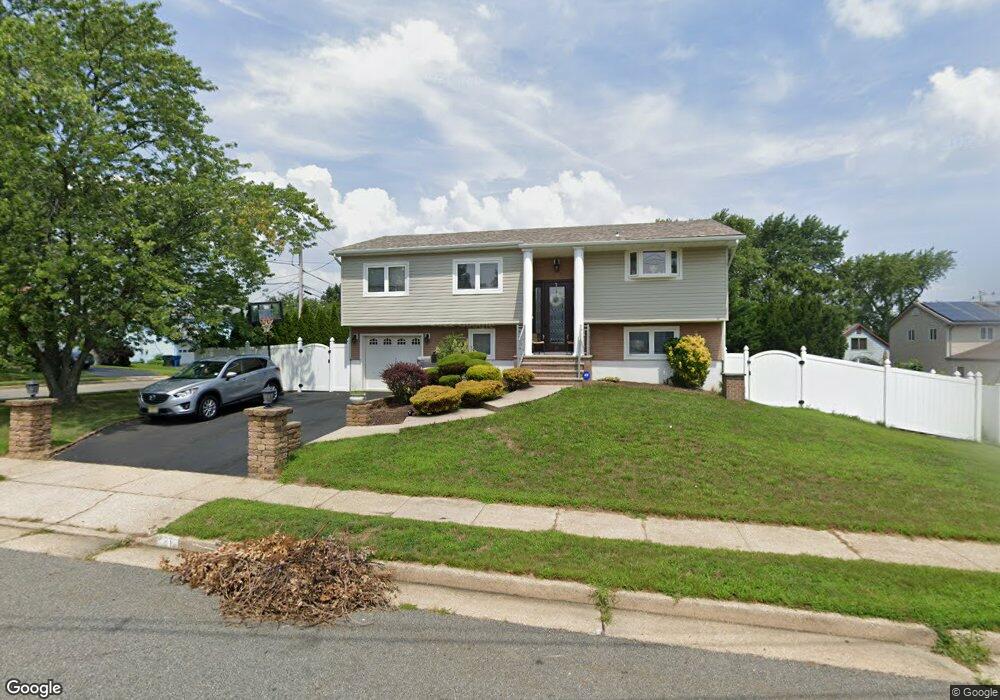
21 Belfast Ave Hazlet, NJ 07730
Estimated Value: $561,000 - $718,000
4
Beds
1
Bath
1,976
Sq Ft
$336/Sq Ft
Est. Value
About This Home
This home is located at 21 Belfast Ave, Hazlet, NJ 07730 and is currently estimated at $664,287, approximately $336 per square foot. 21 Belfast Ave is a home located in Monmouth County with nearby schools including Raritan High School, St Benedict School, and St. Joseph Elementary School.
Ownership History
Date
Name
Owned For
Owner Type
Purchase Details
Closed on
Sep 27, 2006
Sold by
Cawthon Craig
Bought by
Sicilia Giuseppe and Sicilia Rosa
Current Estimated Value
Home Financials for this Owner
Home Financials are based on the most recent Mortgage that was taken out on this home.
Original Mortgage
$180,000
Outstanding Balance
$107,588
Interest Rate
6.49%
Mortgage Type
New Conventional
Estimated Equity
$556,699
Create a Home Valuation Report for This Property
The Home Valuation Report is an in-depth analysis detailing your home's value as well as a comparison with similar homes in the area
Home Values in the Area
Average Home Value in this Area
Purchase History
| Date | Buyer | Sale Price | Title Company |
|---|---|---|---|
| Sicilia Giuseppe | $452,000 | -- |
Source: Public Records
Mortgage History
| Date | Status | Borrower | Loan Amount |
|---|---|---|---|
| Open | Sicilia Giuseppe | $180,000 |
Source: Public Records
Tax History
| Year | Tax Paid | Tax Assessment Tax Assessment Total Assessment is a certain percentage of the fair market value that is determined by local assessors to be the total taxable value of land and additions on the property. | Land | Improvement |
|---|---|---|---|---|
| 2025 | $11,278 | $599,300 | $374,300 | $225,000 |
| 2024 | $10,926 | $536,300 | $312,300 | $224,000 |
| 2023 | $10,926 | $511,300 | $289,300 | $222,000 |
| 2022 | $10,009 | $419,800 | $224,300 | $195,500 |
| 2021 | $10,009 | $390,200 | $216,300 | $173,900 |
| 2020 | $9,819 | $380,300 | $210,300 | $170,000 |
| 2019 | $9,529 | $363,300 | $194,300 | $169,000 |
| 2018 | $9,321 | $352,400 | $191,300 | $161,100 |
| 2017 | $9,059 | $342,500 | $186,300 | $156,200 |
| 2016 | $8,922 | $338,600 | $186,300 | $152,300 |
| 2015 | $8,778 | $334,000 | $185,300 | $148,700 |
| 2014 | $8,437 | $301,100 | $159,300 | $141,800 |
Source: Public Records
Map
Nearby Homes
- 16 Galway Dr
- 20 Galway Dr
- 5 Limerick Place
- 13 Cresci Blvd
- 3 Noble Place
- 627 Beers St
- 9 Parkview Dr
- 46 Parkview Dr
- 7 Kaylen Place
- 642 Holmdel Rd
- 81 Village Green Way
- 11 Chestnut Ridge Rd
- 1 Boyd Rd
- 17 Idlebrook Ln
- 5 7th St
- 4 Templer Way
- 537 S Atlantic Ave
- 55 Lower Main St
- 3 Harrison Ave
- 99 Idlebrook Ln
Your Personal Tour Guide
Ask me questions while you tour the home.