21 Benson St Whitman, MA 02382
Estimated Value: $520,000 - $569,000
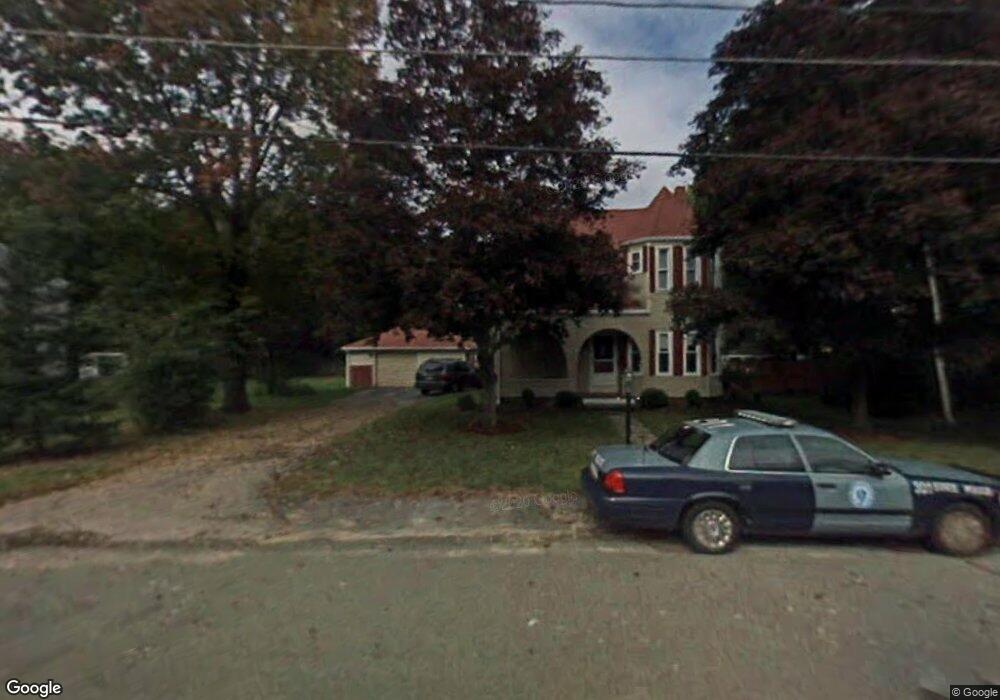
About This Home
This home is located at 21 Benson St, Whitman, MA 02382 and is currently estimated at $535,276, approximately $400 per square foot. 21 Benson St is a home located in Plymouth County with nearby schools including St Bridget School.
Ownership History
We collect this data history from publicly available records. To have your information removed, we recommend requesting removal directly through your county’s website.
Purchase Details
Home Financials for this Owner
Home Financials are based on the most recent Mortgage that was taken out on this home.Purchase Details
Home Financials for this Owner
Home Financials are based on the most recent Mortgage that was taken out on this home.Home Values in the Area
Average Home Value in this Area
Purchase History
We collect this data history from publicly available records. To have your information removed, we recommend requesting removal directly through your county’s website.
| Date | Buyer | Sale Price | Title Company |
|---|---|---|---|
| $360,000 | -- | ||
| $292,500 | -- |
Mortgage History
We collect this data history from publicly available records. To have your information removed, we recommend requesting removal directly through your county’s website.
| Date | Status | Borrower | Loan Amount |
|---|---|---|---|
| Open | $288,000 | ||
| Closed | $22,000 | ||
| Previous Owner | $277,875 |
Tax History
We collect this data history from publicly available records. To have your information removed, we recommend requesting removal directly through your county’s website.
| Year | Tax Paid | Tax Assessment Tax Assessment Total Assessment is a certain percentage of the fair market value that is determined by local assessors to be the total taxable value of land and additions on the property. | Land | Improvement |
|---|---|---|---|---|
| 2025 | $6,225 | $474,500 | $235,100 | $239,400 |
| 2024 | $5,855 | $459,600 | $230,500 | $229,100 |
| 2023 | $5,619 | $414,100 | $200,100 | $214,000 |
| 2022 | $5,560 | $381,900 | $182,100 | $199,800 |
| 2021 | $5,408 | $348,900 | $167,500 | $181,400 |
| 2020 | $5,316 | $335,400 | $159,600 | $175,800 |
| 2019 | $5,028 | $326,900 | $159,600 | $167,300 |
| 2018 | $4,741 | $296,100 | $150,600 | $145,500 |
| 2017 | $4,465 | $296,100 | $150,600 | $145,500 |
| 2016 | $4,376 | $280,700 | $142,700 | $138,000 |
| 2015 | $4,119 | $263,900 | $125,900 | $138,000 |
Map
- 38 Carleton St
- 177 Pleasant St
- 285 Raynor Ave
- 560 South Ave
- 143 Cranberry Rd
- 6 Colebrook Blvd Unit 7
- 37 Lakeview St
- 289 Commercial St
- 214 Winter St
- 55 Plymouth St Unit 40L
- 55 Plymouth St Unit J35
- 418 Beech St
- 751 Washington St
- 129 Commercial St
- 12 Driftwood Ln
- 518 Summer St
- 1012 Washington St
- 5 Satucket Rd
- 44 Morningside Dr
- 340 Centre Ave Unit 7
- 33 Benson St
- 51 Benson St
- 28 Benson St
- 38 Benson St
- 20 Benson St
- 52 Benson St
- 236 Pleasant St
- 236 Pleasant St Unit 2
- 236 Pleasant St Unit 1
- 496 Plymouth St
- 226 Pleasant St
- 54 Benson St
- 470 Plymouth St
- 470 Plymouth St
- 218 Pleasant St
- 79 Benson St
- 29 Carleton St
- 206 Pleasant St
- 210 Pleasant St
- 68 Benson St
Ask me questions while you tour the home.