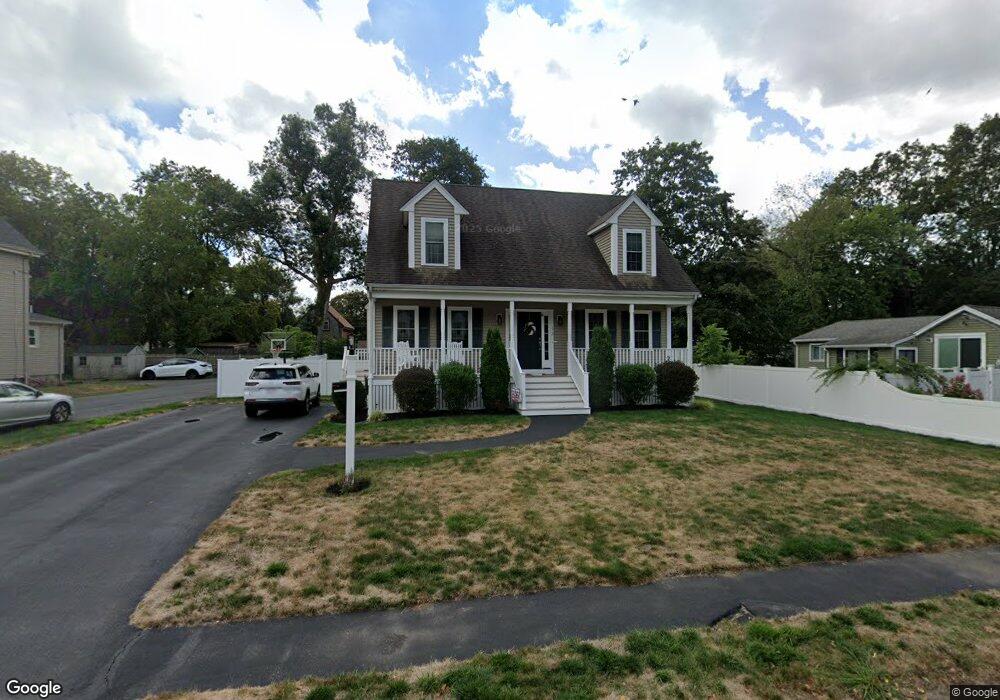
52 Benson St Whitman, MA 02382
Estimated Value: $601,000 - $750,000
3
Beds
2
Baths
2,016
Sq Ft
$328/Sq Ft
Est. Value
About This Home
This home is located at 52 Benson St, Whitman, MA 02382 and is currently estimated at $660,446, approximately $327 per square foot. 52 Benson St is a home located in Plymouth County with nearby schools including St Bridget School.
Ownership History
Date
Name
Owned For
Owner Type
Purchase Details
Closed on
Jun 12, 2009
Sold by
Johnson Edward G
Bought by
Swanson Matthew and Swanson Lauren
Current Estimated Value
Home Financials for this Owner
Home Financials are based on the most recent Mortgage that was taken out on this home.
Original Mortgage
$315,520
Interest Rate
4.82%
Mortgage Type
Purchase Money Mortgage
Purchase Details
Closed on
Nov 26, 2008
Sold by
Shannon Patricia T
Bought by
Johnson Edward G
Home Financials for this Owner
Home Financials are based on the most recent Mortgage that was taken out on this home.
Original Mortgage
$233,000
Interest Rate
6.47%
Mortgage Type
Purchase Money Mortgage
Create a Home Valuation Report for This Property
The Home Valuation Report is an in-depth analysis detailing your home's value as well as a comparison with similar homes in the area
Home Values in the Area
Average Home Value in this Area
Purchase History
| Date | Buyer | Sale Price | Title Company |
|---|---|---|---|
| Swanson Matthew | $394,400 | -- | |
| Johnson Edward G | $140,000 | -- |
Source: Public Records
Mortgage History
| Date | Status | Borrower | Loan Amount |
|---|---|---|---|
| Open | Johnson Edward G | $312,000 | |
| Closed | Johnson Edward G | $315,520 | |
| Previous Owner | Johnson Edward G | $233,000 |
Source: Public Records
Tax History
| Year | Tax Paid | Tax Assessment Tax Assessment Total Assessment is a certain percentage of the fair market value that is determined by local assessors to be the total taxable value of land and additions on the property. | Land | Improvement |
|---|---|---|---|---|
| 2025 | $8,043 | $613,000 | $208,100 | $404,900 |
| 2024 | $7,420 | $582,400 | $204,000 | $378,400 |
| 2023 | $7,094 | $522,800 | $176,900 | $345,900 |
| 2022 | $7,028 | $482,700 | $160,800 | $321,900 |
| 2021 | $6,787 | $437,900 | $147,800 | $290,100 |
| 2020 | $6,674 | $421,100 | $140,700 | $280,400 |
| 2019 | $6,177 | $401,600 | $140,700 | $260,900 |
| 2018 | $5,999 | $374,700 | $132,700 | $242,000 |
| 2017 | $5,616 | $372,400 | $132,700 | $239,700 |
| 2016 | $5,372 | $344,600 | $125,600 | $219,000 |
| 2015 | $5,026 | $322,000 | $110,600 | $211,400 |
Source: Public Records
Map
Nearby Homes
- 147 South Ave
- 227 Winter St
- 214 Winter St
- 55 Plymouth St Unit G27
- 5 Alpine St
- 129 Commercial St
- 56-58 Vernon St
- 456 Beulah St
- 48 Sullivan Terrace
- 94 Progress St Unit 94
- 55 Beulah St
- 157 Warren Ave
- 18 Franklin Hunt Rd
- 87 Summer St
- 353 Birchbark Dr
- 604 Bedford St Unit 2
- 9 Lydon Ln Unit A1-9
- 15 Willow Pond Dr
- 300 High St
- 93 Central St
Your Personal Tour Guide
Ask me questions while you tour the home.