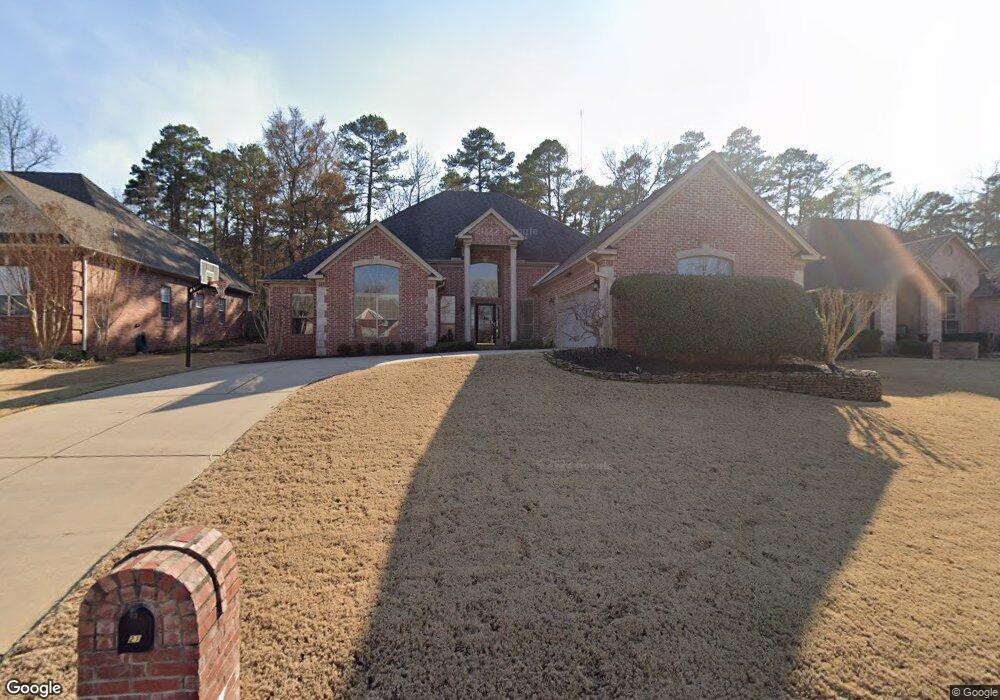
21 Berney Way Dr Little Rock, AR 72223
Chenal Valley NeighborhoodEstimated Value: $425,761 - $498,000
--
Bed
4
Baths
2,956
Sq Ft
$156/Sq Ft
Est. Value
About This Home
This home is located at 21 Berney Way Dr, Little Rock, AR 72223 and is currently estimated at $461,690, approximately $156 per square foot. 21 Berney Way Dr is a home located in Pulaski County with nearby schools including Joe T. Robinson Elementary School, Joe T. Robinson Middle School, and Joe T. Robinson High School.
Ownership History
Date
Name
Owned For
Owner Type
Purchase Details
Closed on
May 20, 2015
Sold by
Franklin Anthony B and Franklin Patrice L
Bought by
Franklin Living Trust and Franklin Patrice
Current Estimated Value
Purchase Details
Closed on
Jun 25, 2009
Sold by
Koravos Linda
Bought by
Franklin Anthony B and Franklin Patrice L
Home Financials for this Owner
Home Financials are based on the most recent Mortgage that was taken out on this home.
Original Mortgage
$270,240
Outstanding Balance
$172,575
Interest Rate
4.97%
Mortgage Type
New Conventional
Estimated Equity
$289,115
Purchase Details
Closed on
Aug 15, 2005
Sold by
Kinnaman Lelland Arthur and Kinnaman Kimberly Dawn
Bought by
Koravos Linda
Home Financials for this Owner
Home Financials are based on the most recent Mortgage that was taken out on this home.
Original Mortgage
$205,210
Interest Rate
5.65%
Mortgage Type
Purchase Money Mortgage
Purchase Details
Closed on
May 8, 1998
Sold by
Deltic Timber Corp
Bought by
Kinnaman Lelland Arthur and Kinnaman Kimberly Dawn
Create a Home Valuation Report for This Property
The Home Valuation Report is an in-depth analysis detailing your home's value as well as a comparison with similar homes in the area
Home Values in the Area
Average Home Value in this Area
Purchase History
| Date | Buyer | Sale Price | Title Company |
|---|---|---|---|
| Franklin Living Trust | -- | None Available | |
| Franklin Anthony B | $297,000 | Multiple | |
| Koravos Linda | $296,000 | First National Title | |
| Kinnaman Lelland Arthur | $40,000 | -- |
Source: Public Records
Mortgage History
| Date | Status | Borrower | Loan Amount |
|---|---|---|---|
| Open | Franklin Anthony B | $270,240 | |
| Previous Owner | Koravos Linda | $205,210 |
Source: Public Records
Tax History Compared to Growth
Tax History
| Year | Tax Paid | Tax Assessment Tax Assessment Total Assessment is a certain percentage of the fair market value that is determined by local assessors to be the total taxable value of land and additions on the property. | Land | Improvement |
|---|---|---|---|---|
| 2025 | $3,967 | $76,102 | $8,400 | $67,702 |
| 2024 | $3,967 | $76,102 | $8,400 | $67,702 |
| 2023 | $3,967 | $76,102 | $8,400 | $67,702 |
| 2022 | $3,967 | $76,102 | $8,400 | $67,702 |
| 2021 | $3,998 | $61,700 | $8,000 | $53,700 |
| 2020 | $3,592 | $61,700 | $8,000 | $53,700 |
| 2019 | $3,592 | $61,700 | $8,000 | $53,700 |
| 2018 | $3,617 | $61,700 | $8,000 | $53,700 |
| 2017 | $3,617 | $61,700 | $8,000 | $53,700 |
| 2016 | $3,657 | $62,310 | $10,400 | $51,910 |
| 2015 | $4,037 | $62,310 | $10,400 | $51,910 |
| 2014 | $4,037 | $62,307 | $10,400 | $51,907 |
Source: Public Records
Map
Nearby Homes
- 31 Rosaires Way
- 19 Bishop Place
- 9 Bishop Place
- 8 Arles Dr
- 18021 Cantrell Rd
- 425 Valley Ranch Cir
- 0142 Valley Ranch Dr
- 429 Valley Ranch Cir
- 424 Valley Ranch Cir
- 44 Durance Dr
- 22 Margeaux Dr
- 30 Duquesne Dr
- 145 Calion Ct
- 108 Bronte Cir
- 135 Calion Ct
- 28 Bronte Ct
- 5 Mountain Brook Rd
- 146 Calion Ct
- 120 Calion Ct
- 138 Calion Ct
- 19 Berney Way Dr
- 23 Berney Way Dr
- 17 Berney Way Dr
- 25 Berney Way Dr
- 18 Berney Way Dr
- 20 Berney Way Dr
- 16 Berney Way Dr
- 22 Berney Way Dr
- 15 Berney Way Dr
- 27 Berney Way Dr
- 14 Berney Way Dr
- 24 Berney Way Dr
- 9 Gravelle Dr
- 11 Gravelle Dr
- 12 Berney Way Dr
- 11 Berney Way Dr
- 26 Berney Way Dr
- 15 Gravelle Dr
- 5 Gravelle Dr
- 0 Gravelle Dr