21 Bridge St Hatfield, MA 01038
Estimated Value: $358,000 - $459,788
3
Beds
1
Bath
1,740
Sq Ft
$229/Sq Ft
Est. Value
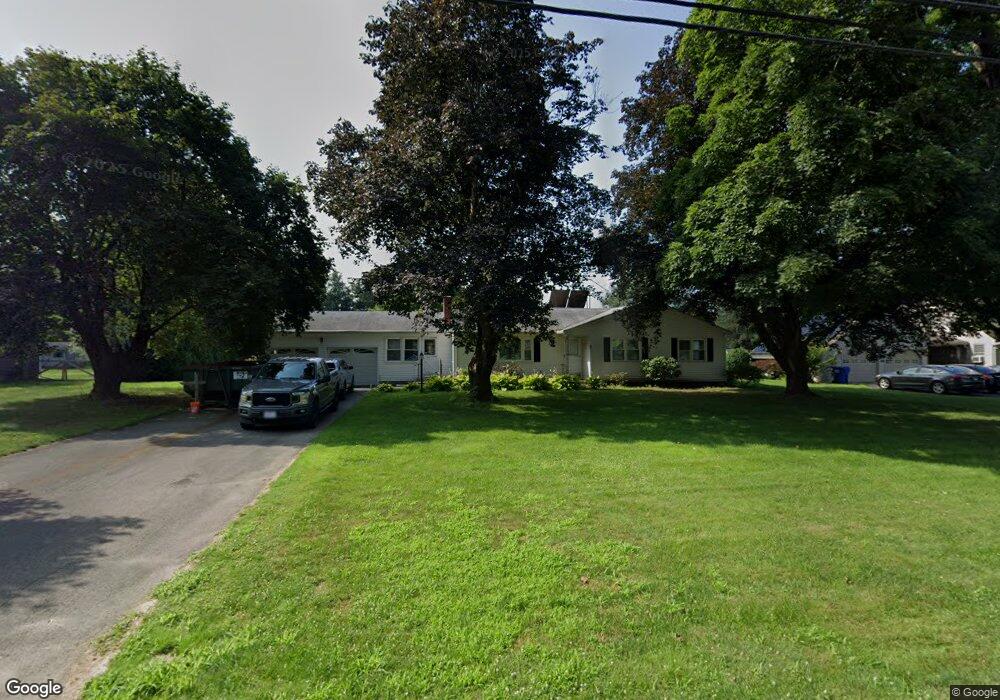
About This Home
This home is located at 21 Bridge St, Hatfield, MA 01038 and is currently estimated at $399,197, approximately $229 per square foot. 21 Bridge St is a home located in Hampshire County with nearby schools including Hatfield Elementary School and Smith Academy.
Ownership History
Date
Name
Owned For
Owner Type
Purchase Details
Closed on
Feb 5, 2025
Sold by
Pitchko James F
Bought by
Intravaia Tiffany and Banas Kenneth
Current Estimated Value
Purchase Details
Closed on
Jun 11, 2024
Sold by
Pitchko Ft and Pitchko
Bought by
Pitchko James F
Purchase Details
Closed on
Sep 9, 2021
Sold by
Pitchko Stanley J and Pitchko Joan M
Bought by
Pitchko Ft and Pitchko
Create a Home Valuation Report for This Property
The Home Valuation Report is an in-depth analysis detailing your home's value as well as a comparison with similar homes in the area
Home Values in the Area
Average Home Value in this Area
Purchase History
| Date | Buyer | Sale Price | Title Company |
|---|---|---|---|
| Intravaia Tiffany | $342,000 | None Available | |
| Intravaia Tiffany | $342,000 | None Available | |
| Pitchko James F | -- | None Available | |
| Pitchko James F | -- | None Available | |
| Pitchko James F | -- | None Available | |
| Pitchko Ft | -- | None Available | |
| Pitchko Ft | -- | None Available | |
| Pitchko Ft | -- | None Available |
Source: Public Records
Tax History
| Year | Tax Paid | Tax Assessment Tax Assessment Total Assessment is a certain percentage of the fair market value that is determined by local assessors to be the total taxable value of land and additions on the property. | Land | Improvement |
|---|---|---|---|---|
| 2025 | $5,118 | $369,800 | $139,500 | $230,300 |
| 2024 | $4,985 | $325,600 | $121,600 | $204,000 |
| 2023 | $4,159 | $308,500 | $115,600 | $192,900 |
| 2022 | $3,926 | $287,200 | $109,600 | $177,600 |
| 2021 | $3,739 | $263,500 | $99,700 | $163,800 |
| 2020 | $3,565 | $263,500 | $99,700 | $163,800 |
| 2019 | $3,450 | $248,400 | $97,700 | $150,700 |
| 2018 | $3,331 | $245,300 | $97,700 | $147,600 |
| 2017 | $3,226 | $244,000 | $97,700 | $146,300 |
| 2016 | $3,216 | $244,000 | $97,700 | $146,300 |
| 2015 | $3,109 | $236,100 | $87,700 | $148,400 |
| 2014 | $2,991 | $236,100 | $87,700 | $148,400 |
Source: Public Records
Map
Nearby Homes
- 18 Elm St
- 71 Chestnut St
- 58 Main St Unit 4
- 58 Main St Unit 3
- 149 Prospect St
- 0 Straits Rd
- 43 Laurel Park Unit 43
- 59 N Hatfield Rd
- 27 River Dr
- 11 West St
- 0 N Branch Rd
- 32 Stonewall Dr
- 26 Russell St Unit A-B
- 80 Damon Rd Unit 8201
- 80 Damon Rd Unit 5104
- 80 Damon Rd Unit 4302
- 88 Pines Edge Dr Unit 88
- 151 Pantry Rd
- 211 Russell St
- 133 Middle St
Your Personal Tour Guide
Ask me questions while you tour the home.