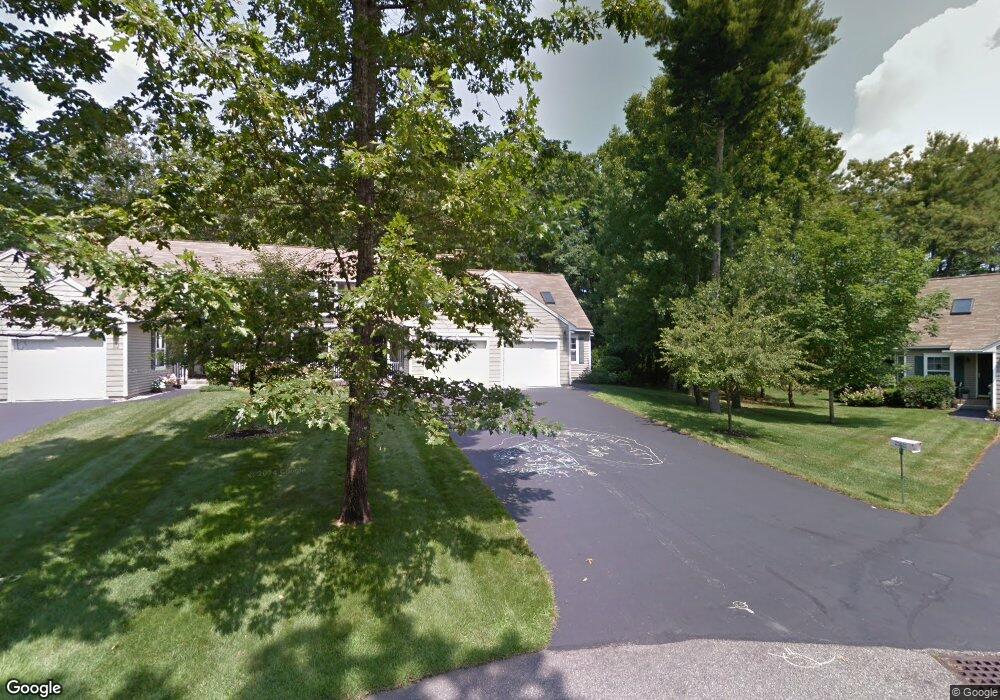
21 Bristol Ct Kennebunk, ME 04043
Estimated Value: $493,053 - $562,000
3
Beds
3
Baths
1,369
Sq Ft
$384/Sq Ft
Est. Value
About This Home
This home is located at 21 Bristol Ct, Kennebunk, ME 04043 and is currently estimated at $525,513, approximately $383 per square foot. 21 Bristol Ct is a home located in York County with nearby schools including Kennebunk High School and The New School.
Ownership History
Date
Name
Owned For
Owner Type
Purchase Details
Closed on
Aug 9, 2016
Sold by
Hess Martha B
Bought by
Bristol Court Llc
Current Estimated Value
Purchase Details
Closed on
Jun 22, 2015
Sold by
Lyman Ernestine
Bought by
Hess Martha B
Home Financials for this Owner
Home Financials are based on the most recent Mortgage that was taken out on this home.
Original Mortgage
$180,000
Interest Rate
3%
Mortgage Type
Adjustable Rate Mortgage/ARM
Purchase Details
Closed on
Apr 20, 2010
Sold by
Charlton Scott P and Charlton Ann E
Bought by
Lyman Ernestine
Purchase Details
Closed on
Nov 20, 2008
Sold by
Hulsey Oliver K
Bought by
Charlton Scott P and Charlton Ann E
Home Financials for this Owner
Home Financials are based on the most recent Mortgage that was taken out on this home.
Original Mortgage
$172,000
Interest Rate
6.03%
Mortgage Type
Unknown
Create a Home Valuation Report for This Property
The Home Valuation Report is an in-depth analysis detailing your home's value as well as a comparison with similar homes in the area
Home Values in the Area
Average Home Value in this Area
Purchase History
| Date | Buyer | Sale Price | Title Company |
|---|---|---|---|
| Bristol Court Llc | -- | -- | |
| Hess Martha B | -- | -- | |
| Lyman Ernestine | -- | -- | |
| Charlton Scott P | -- | -- |
Source: Public Records
Mortgage History
| Date | Status | Borrower | Loan Amount |
|---|---|---|---|
| Closed | Hess Martha B | $180,000 | |
| Previous Owner | Charlton Scott P | $172,000 |
Source: Public Records
Tax History Compared to Growth
Tax History
| Year | Tax Paid | Tax Assessment Tax Assessment Total Assessment is a certain percentage of the fair market value that is determined by local assessors to be the total taxable value of land and additions on the property. | Land | Improvement |
|---|---|---|---|---|
| 2024 | $5,039 | $297,300 | $80,000 | $217,300 |
| 2023 | $4,772 | $297,300 | $80,000 | $217,300 |
| 2022 | $4,341 | $297,300 | $80,000 | $217,300 |
| 2021 | $4,237 | $297,300 | $80,000 | $217,300 |
| 2020 | $4,207 | $297,300 | $80,000 | $217,300 |
| 2019 | $4,088 | $297,300 | $80,000 | $217,300 |
| 2018 | $3,903 | $223,000 | $60,000 | $163,000 |
| 2017 | $3,691 | $223,000 | $60,000 | $163,000 |
| 2016 | $3,546 | $223,000 | $60,000 | $163,000 |
| 2015 | $3,412 | $223,000 | $60,000 | $163,000 |
| 2014 | $3,323 | $223,000 | $60,000 | $163,000 |
Source: Public Records
Map
Nearby Homes
- 3 Kensington Dr
- 6 Dunnhill Dr Unit 28
- 22 Winchester Ct
- 14 Hampton Glen Dr Unit 51
- 9 Hampton Glen Dr Unit 3
- 056 Cat Mousam Rd
- 17 Hampton Glen Dr Unit 5
- 3 Nichols Ln
- 29 Bentley Place Unit 50
- 108 Hampton Glen Dr Unit 108
- 23 Lilac Ln
- 25 Cambridge Ct
- 59 Plymouth Grove Unit 11
- 23 Cascade Cir Unit 22
- 19 Old Alewive Rd
- 15 Casey Ln
- 3 Hardwood Dr
- 61 Fletcher St
- 5 Wiggins Pond Ln
- 16 Oakwood Ln Unit 16
- 21 Bristol Ct Unit 21
- 21 Bristol Ct Unit 13
- 23 Bristol Ct
- 23 Bristol Ct Unit 14
- 25 Bristol Ct
- 27 Bristol Ct
- 15 Bristol Ct
- 15 Bristol Ct Unit 15
- 17 Bristol Ct
- 11 Bristol Ct
- 11 Bristol Ct Unit 10
- 25 Kensington Dr
- 9 Bristol Ct
- 0 Bristol Court Chatham Village Unit 11
- 27 Kensington Dr
- 29 Kensington Dr
- 7 Bristol Ct
- 5 Bristol Ct
- 3 Bristol Ct
- 31 Kensington Dr