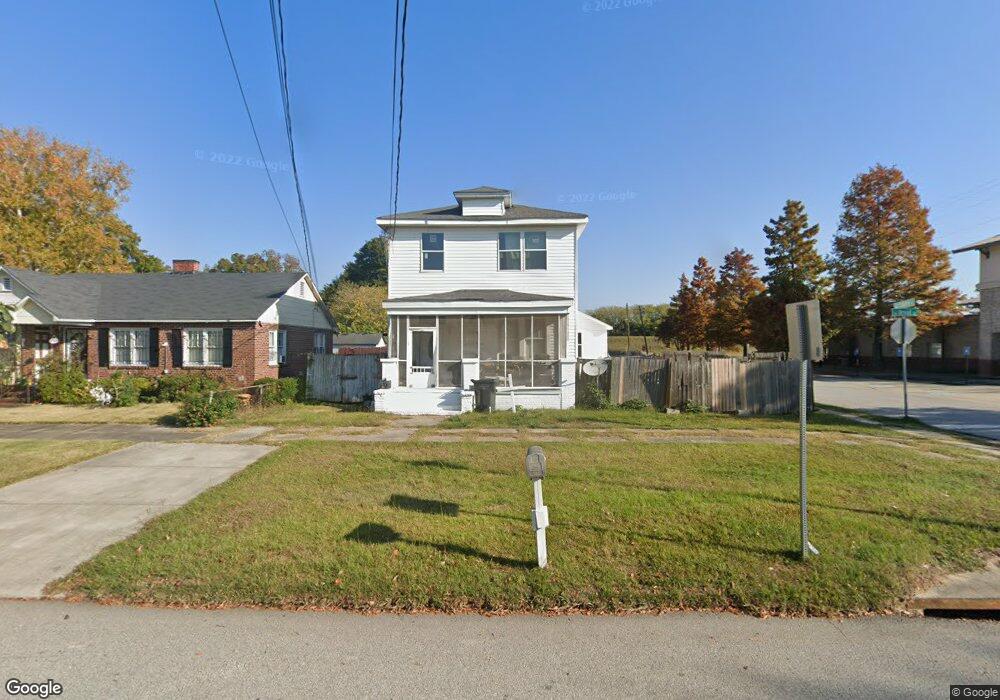
21 Broad St Augusta, GA 30901
Olde Town-Pinched Gut NeighborhoodEstimated Value: $179,000 - $241,000
3
Beds
2
Baths
2,136
Sq Ft
$98/Sq Ft
Est. Value
About This Home
This home is located at 21 Broad St, Augusta, GA 30901 and is currently estimated at $208,620, approximately $97 per square foot. 21 Broad St is a home located in Richmond County with nearby schools including W.S. Hornsby School, W.S. Hornsby Elementary School, and Johnson Magnet.
Ownership History
Date
Name
Owned For
Owner Type
Purchase Details
Closed on
Oct 24, 2023
Sold by
Gilmore Michael B
Bought by
Yarbray Leola B and Yarbray Leola D
Current Estimated Value
Purchase Details
Closed on
Feb 18, 2011
Sold by
Gilmore Michael B
Bought by
Gilmore Mary L
Purchase Details
Closed on
May 26, 2005
Sold by
Gilmore Keiyana
Bought by
Gilmore Michael
Purchase Details
Closed on
Apr 19, 2002
Sold by
Gilmore Michael B
Bought by
Gilmore Keiyana Michelle
Purchase Details
Closed on
Nov 3, 2000
Sold by
Gaines Henry C and Gaines Henry C
Bought by
Gilmore Michael B
Purchase Details
Closed on
Feb 15, 2000
Sold by
Taylor Elton
Bought by
Gaines Henry C
Purchase Details
Closed on
Apr 5, 1996
Sold by
Gaines Henry C Tr
Bought by
Taylor Elton
Purchase Details
Closed on
Mar 11, 1991
Sold by
Gaines Lessie Louise
Bought by
Gaines Henry C As Trustee
Create a Home Valuation Report for This Property
The Home Valuation Report is an in-depth analysis detailing your home's value as well as a comparison with similar homes in the area
Home Values in the Area
Average Home Value in this Area
Purchase History
| Date | Buyer | Sale Price | Title Company |
|---|---|---|---|
| Yarbray Leola B | -- | -- | |
| Gilmore Mary L | -- | -- | |
| Gilmore Michael | -- | -- | |
| Gilmore Keiyana Michelle | -- | -- | |
| Gilmore Michael B | $12,000 | -- | |
| Gaines Henry C | $24,300 | -- | |
| Gaines Henry C | -- | -- | |
| Taylor Elton | $27,000 | -- | |
| Gaines Henry C As Trustee | -- | -- |
Source: Public Records
Tax History
| Year | Tax Paid | Tax Assessment Tax Assessment Total Assessment is a certain percentage of the fair market value that is determined by local assessors to be the total taxable value of land and additions on the property. | Land | Improvement |
|---|---|---|---|---|
| 2025 | $2,505 | $73,308 | $2,139 | $71,169 |
| 2024 | $2,505 | $57,232 | $2,139 | $55,093 |
| 2023 | $705 | $63,450 | $2,139 | $61,311 |
| 2022 | $849 | $51,642 | $2,139 | $49,503 |
| 2021 | $713 | $37,858 | $2,134 | $35,724 |
| 2020 | $632 | $31,993 | $2,134 | $29,859 |
| 2019 | $354 | $12,798 | $2,134 | $10,664 |
| 2018 | $355 | $12,798 | $2,134 | $10,664 |
| 2017 | $765 | $12,798 | $2,134 | $10,664 |
| 2016 | $1,080 | $21,656 | $2,134 | $19,521 |
| 2015 | $907 | $21,656 | $2,134 | $19,521 |
| 2014 | $908 | $21,656 | $2,134 | $19,521 |
Source: Public Records
Map
Nearby Homes
- 107 Sibley St
- 106 Forsythe St
- 106 2nd St
- 114 Ellis St
- 206 Reynolds St
- 29 Savannah River Place
- 7033 Tallulah Ln
- 247 Ellis St
- 228 Greene St
- 7275 Tallulah Ln
- 204 Telfair St
- 313 Ellis St
- 461 Rivernorth Dr
- 1504 Satilla Place
- 270 Rivernorth Dr
- 1536 Satilla Place
- 109 E Walker St
- 205 Japonica Ave
- 642 Rivernorth Dr
- 628 Rivernorth Dr
Your Personal Tour Guide
Ask me questions while you tour the home.