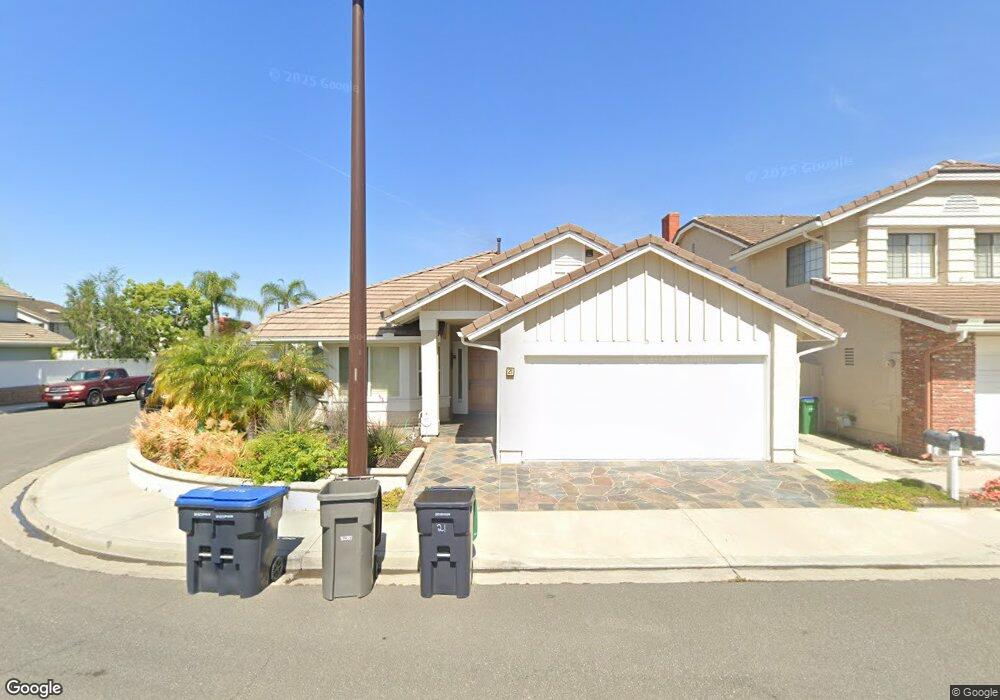
21 Carnelian Irvine, CA 92614
Woodbridge NeighborhoodEstimated Value: $1,568,373 - $1,933,000
3
Beds
2
Baths
1,784
Sq Ft
$992/Sq Ft
Est. Value
About This Home
This home is located at 21 Carnelian, Irvine, CA 92614 and is currently estimated at $1,769,343, approximately $991 per square foot. 21 Carnelian is a home located in Orange County with nearby schools including Springbrook Elementary School, South Lake Middle School, and Woodbridge High School.
Ownership History
Date
Name
Owned For
Owner Type
Purchase Details
Closed on
Feb 12, 2024
Sold by
Fami Graham and Fami Judith
Bought by
Graham Needham And Judith A Needham Family Tr and Dunnigan
Current Estimated Value
Purchase Details
Closed on
Oct 24, 2000
Sold by
Graham Needham and Graham Judith
Bought by
Needham Graham and Needham Judith A
Purchase Details
Closed on
Mar 4, 1999
Sold by
Janosko Chris E and Janosko Katherin
Bought by
Needham Graham and Needham Judith A
Home Financials for this Owner
Home Financials are based on the most recent Mortgage that was taken out on this home.
Original Mortgage
$100,000
Interest Rate
6.87%
Purchase Details
Closed on
Oct 17, 1995
Sold by
Stockwell Walter L and Stockwell Clara R
Bought by
Janosko Chris E and Janosko Katherin
Home Financials for this Owner
Home Financials are based on the most recent Mortgage that was taken out on this home.
Original Mortgage
$229,600
Interest Rate
7.62%
Create a Home Valuation Report for This Property
The Home Valuation Report is an in-depth analysis detailing your home's value as well as a comparison with similar homes in the area
Home Values in the Area
Average Home Value in this Area
Purchase History
| Date | Buyer | Sale Price | Title Company |
|---|---|---|---|
| Graham Needham And Judith A Needham Family Tr | -- | None Listed On Document | |
| Needham Graham | -- | -- | |
| Needham Graham | $368,000 | Orange Coast Title | |
| Janosko Chris E | $287,000 | Commonwealth Land Title Co |
Source: Public Records
Mortgage History
| Date | Status | Borrower | Loan Amount |
|---|---|---|---|
| Previous Owner | Needham Graham | $100,000 | |
| Previous Owner | Janosko Chris E | $229,600 |
Source: Public Records
Tax History
| Year | Tax Paid | Tax Assessment Tax Assessment Total Assessment is a certain percentage of the fair market value that is determined by local assessors to be the total taxable value of land and additions on the property. | Land | Improvement |
|---|---|---|---|---|
| 2025 | $5,924 | $554,854 | $267,994 | $286,860 |
| 2024 | $5,924 | $543,975 | $262,739 | $281,236 |
| 2023 | $5,771 | $533,309 | $257,587 | $275,722 |
| 2022 | $5,659 | $522,852 | $252,536 | $270,316 |
| 2021 | $5,529 | $512,600 | $247,584 | $265,016 |
| 2020 | $5,498 | $507,344 | $245,045 | $262,299 |
| 2019 | $5,377 | $497,397 | $240,241 | $257,156 |
| 2018 | $5,281 | $487,645 | $235,531 | $252,114 |
| 2017 | $5,173 | $478,084 | $230,913 | $247,171 |
| 2016 | $4,947 | $468,710 | $226,385 | $242,325 |
| 2015 | $4,803 | $461,670 | $222,984 | $238,686 |
| 2014 | $4,710 | $452,627 | $218,616 | $234,011 |
Source: Public Records
Map
Nearby Homes
- 36 Bloomdale
- 9 Flaxwood
- 39 Foxboro
- 527 Springbrook N
- 226 Greenmoor Unit 95
- 12 Primrose Unit 48
- 123 Fallingstar Unit 1
- 11 Fallingstar
- 20 Wintermist
- 32 Spinnaker Unit 71
- 35 Firwood
- 45 Wintermist Unit 36
- 4 Dogwood N
- 52 Danbury Ln
- 39 Dogwood S
- 18 Woodsorrel
- 7 Spring Buck
- 77 Greenbough Unit 155
- 17322 Rosewood
- 9 Lilac
Your Personal Tour Guide
Ask me questions while you tour the home.