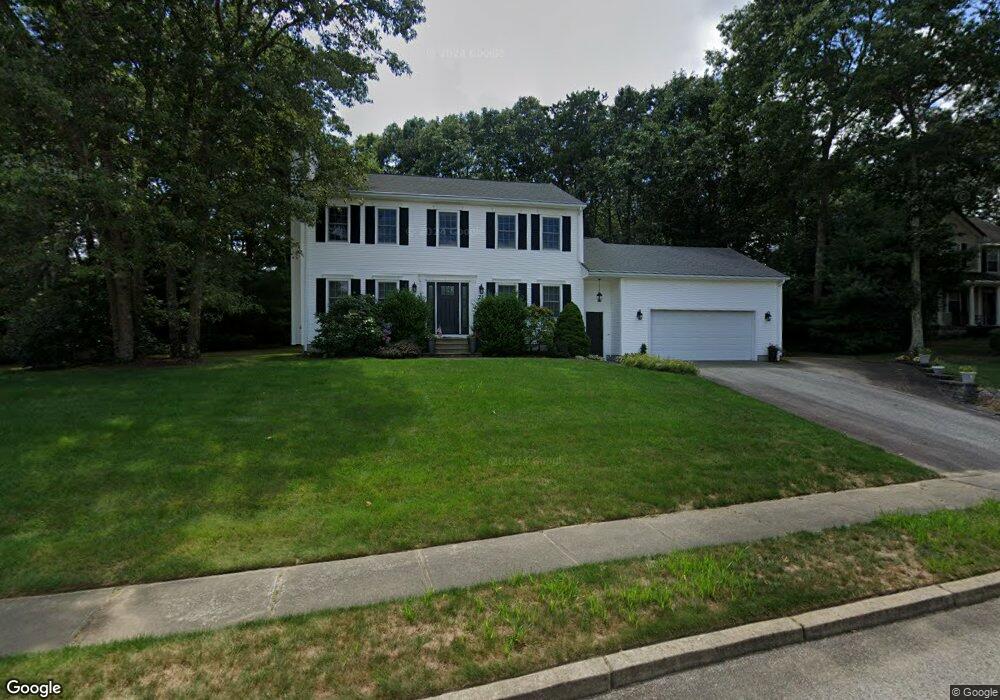
21 Catalpa Way Coventry, RI 02816
Estimated Value: $685,656 - $720,000
4
Beds
3
Baths
2,187
Sq Ft
$324/Sq Ft
Est. Value
About This Home
This home is located at 21 Catalpa Way, Coventry, RI 02816 and is currently estimated at $707,914, approximately $323 per square foot. 21 Catalpa Way is a home located in Kent County with nearby schools including Alan Shawn Feinstein Ms Of Cov, Coventry High School, and Father John V. Doyle School.
Ownership History
Date
Name
Owned For
Owner Type
Purchase Details
Closed on
Dec 21, 2021
Sold by
Lomi Peter A and Lomi Kathleen M
Bought by
Peter A Lomi T
Current Estimated Value
Purchase Details
Closed on
Jul 29, 2005
Sold by
Angell Adam P and Angell Tracey E
Bought by
Lomi Peter A and Lomi Kathleen M
Home Financials for this Owner
Home Financials are based on the most recent Mortgage that was taken out on this home.
Original Mortgage
$215,000
Interest Rate
5.67%
Mortgage Type
Purchase Money Mortgage
Purchase Details
Closed on
Jun 17, 2002
Sold by
Porz Heinrech C and Porz Shorn
Bought by
Angell Adam P and Angell Tracey E
Home Financials for this Owner
Home Financials are based on the most recent Mortgage that was taken out on this home.
Original Mortgage
$235,200
Interest Rate
6.8%
Purchase Details
Closed on
May 1, 1998
Sold by
Quality Bldg Svcs Inc
Bought by
Porz Heinrech C and Porz Shorn
Home Financials for this Owner
Home Financials are based on the most recent Mortgage that was taken out on this home.
Original Mortgage
$225,000
Interest Rate
7.04%
Purchase Details
Closed on
Jan 8, 1998
Sold by
Merriam David and Cerio Edward
Bought by
Quality Building Serv
Create a Home Valuation Report for This Property
The Home Valuation Report is an in-depth analysis detailing your home's value as well as a comparison with similar homes in the area
Home Values in the Area
Average Home Value in this Area
Purchase History
| Date | Buyer | Sale Price | Title Company |
|---|---|---|---|
| Peter A Lomi T | -- | None Available | |
| Lomi Peter A | $442,000 | -- | |
| Angell Adam P | $294,000 | -- | |
| Porz Heinrech C | $225,000 | -- | |
| Quality Building Serv | $65,000 | -- |
Source: Public Records
Mortgage History
| Date | Status | Borrower | Loan Amount |
|---|---|---|---|
| Previous Owner | Quality Building Serv | $217,000 | |
| Previous Owner | Quality Building Serv | $215,000 | |
| Previous Owner | Quality Building Serv | $235,200 | |
| Previous Owner | Quality Building Serv | $225,000 |
Source: Public Records
Tax History Compared to Growth
Tax History
| Year | Tax Paid | Tax Assessment Tax Assessment Total Assessment is a certain percentage of the fair market value that is determined by local assessors to be the total taxable value of land and additions on the property. | Land | Improvement |
|---|---|---|---|---|
| 2024 | $7,937 | $501,100 | $163,200 | $337,900 |
| 2023 | $7,682 | $501,100 | $163,200 | $337,900 |
| 2022 | $7,464 | $381,400 | $153,900 | $227,500 |
| 2021 | $7,399 | $381,400 | $153,900 | $227,500 |
| 2020 | $8,482 | $381,400 | $153,900 | $227,500 |
| 2019 | $7,435 | $334,300 | $132,100 | $202,200 |
| 2018 | $7,224 | $334,300 | $132,100 | $202,200 |
| 2017 | $7,014 | $334,300 | $132,100 | $202,200 |
| 2016 | $6,828 | $318,900 | $113,400 | $205,500 |
| 2015 | $6,643 | $318,900 | $113,400 | $205,500 |
| 2014 | $6,504 | $318,900 | $113,400 | $205,500 |
| 2013 | $6,453 | $345,800 | $124,400 | $221,400 |
Source: Public Records
Map
Nearby Homes
- 42 Kiley Way
- 13 Valiant Dr
- 3 Regalwood Dr
- 22 Valiant Dr
- 89 Wright Way
- 7 June Ct
- 5 June Ct
- 3 Lear Dr
- 33 Sunset Lake Cir
- 81 Sunset Lake Cir
- 51 Sunset Lake Cir
- 21 Lear Dr
- 88 Sunset Lake Cir Unit 88
- 83 Sunset Lake Cir
- 15 Kelly Ln
- 8 King Philip Rd
- 35 Liena Rose Way
- 9 Giovanni Rose Ct
- 16 Giovanni Rose Ct
- 8 Winterberry Dr
- 19 Catalpa Way
- 23 Catalpa Way
- 10 White Oak Ct
- 12 White Oak Ct
- 22 Catalpa Way
- 20 Catalpa Way
- 6 White Oak Ct
- 24 Catalpa Way
- 46 Catalpa Way
- 26 Catalpa Way
- 18 Catalpa Way
- 17 Catalpa Way
- 11 White Oak Ct
- 25 Catalpa Way
- 13 White Oak Ct
- 3 White Oak Ct
- 33 Catalpa Way
- 34 Catalpa Way
- 9 White Oak Ct
- 15 White Oak Ct