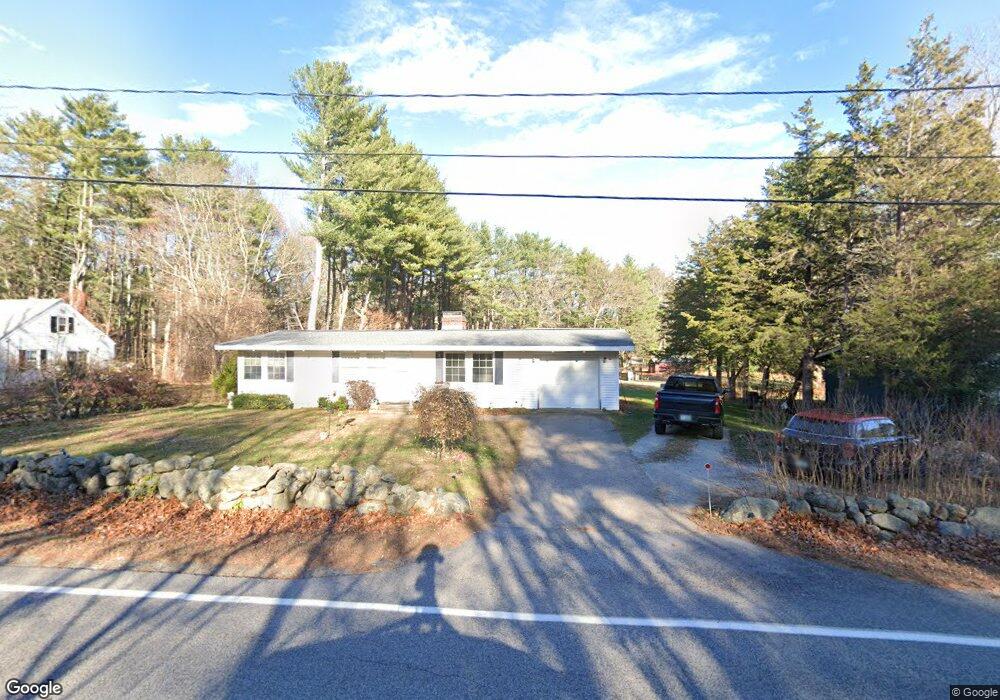
21 Cedar Rd North Hampton, NH 03862
Estimated Value: $496,014 - $665,000
3
Beds
2
Baths
1,144
Sq Ft
$476/Sq Ft
Est. Value
About This Home
This home is located at 21 Cedar Rd, North Hampton, NH 03862 and is currently estimated at $545,004, approximately $476 per square foot. 21 Cedar Rd is a home with nearby schools including North Hampton School, Winnacunnet High School, and Sacred Heart School.
Ownership History
Date
Name
Owned For
Owner Type
Purchase Details
Closed on
Dec 22, 2000
Sold by
Fritz Marian A
Bought by
Leis Alessandra
Current Estimated Value
Home Financials for this Owner
Home Financials are based on the most recent Mortgage that was taken out on this home.
Original Mortgage
$203,300
Outstanding Balance
$74,972
Interest Rate
7.71%
Estimated Equity
$470,032
Create a Home Valuation Report for This Property
The Home Valuation Report is an in-depth analysis detailing your home's value as well as a comparison with similar homes in the area
Home Values in the Area
Average Home Value in this Area
Purchase History
| Date | Buyer | Sale Price | Title Company |
|---|---|---|---|
| Leis Alessandra | $214,000 | -- |
Source: Public Records
Mortgage History
| Date | Status | Borrower | Loan Amount |
|---|---|---|---|
| Open | Leis Alessandra | $100,000 | |
| Open | Leis Alessandra | $203,300 |
Source: Public Records
Tax History
| Year | Tax Paid | Tax Assessment Tax Assessment Total Assessment is a certain percentage of the fair market value that is determined by local assessors to be the total taxable value of land and additions on the property. | Land | Improvement |
|---|---|---|---|---|
| 2024 | $4,755 | $371,500 | $171,000 | $200,500 |
| 2023 | $4,625 | $371,500 | $171,000 | $200,500 |
| 2022 | $4,646 | $270,600 | $134,500 | $136,100 |
| 2021 | $4,484 | $270,600 | $134,500 | $136,100 |
| 2020 | $11,596 | $270,600 | $134,500 | $136,100 |
| 2019 | $4,519 | $270,600 | $134,500 | $136,100 |
| 2018 | $4,395 | $270,600 | $134,500 | $136,100 |
| 2017 | $3,793 | $205,000 | $105,500 | $99,500 |
| 2016 | $9,511 | $205,000 | $105,500 | $99,500 |
| 2015 | $3,583 | $205,000 | $105,500 | $99,500 |
| 2014 | $3,495 | $205,000 | $105,500 | $99,500 |
| 2013 | $3,434 | $205,000 | $105,500 | $99,500 |
Source: Public Records
Map
Nearby Homes
- 38 Mill Rd
- 11 Lamson Ln
- 25 Stevens Rd
- 9 Garrett Dr
- 139 Atlantic Ave
- 20 Sandpiper Path
- 78 Dearborn Ave
- none None
- 6 Rice Terrace
- 407 Lafayette Rd
- 49 Exeter Rd
- 10 Mcdermott Rd
- 12 Runnymede Dr
- 193 Mill Rd
- 27 Dunvegan Woods
- 415 High St Unit 3
- 11 Stoneledge Rd
- 4 Limestone Way
- 9 Slate Run
- 17 Sage Dr Unit 22
Your Personal Tour Guide
Ask me questions while you tour the home.