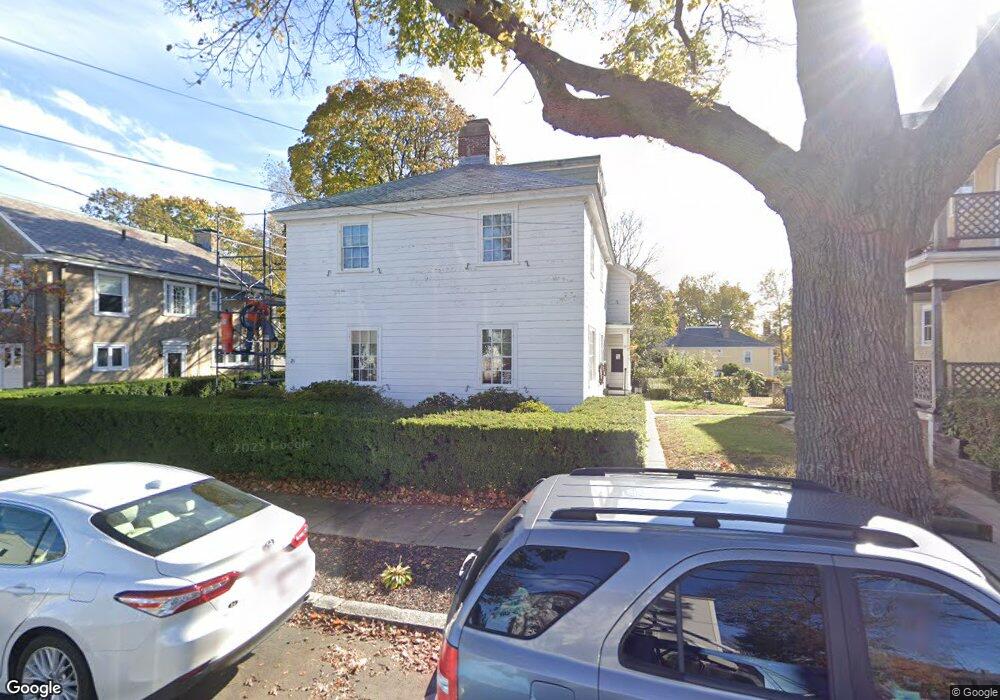
21 Cedar St Salem, MA 01970
South Salem NeighborhoodEstimated Value: $673,577 - $922,000
3
Beds
1
Bath
2,265
Sq Ft
$342/Sq Ft
Est. Value
About This Home
This home is located at 21 Cedar St, Salem, MA 01970 and is currently estimated at $773,644, approximately $341 per square foot. 21 Cedar St is a home located in Essex County with nearby schools including Saltonstall School, Carlton Elementary School, and Bates Elementary School.
Ownership History
Date
Name
Owned For
Owner Type
Purchase Details
Closed on
Dec 15, 1995
Sold by
Broadhead Eleanor
Bought by
Obrien Shawn and Beland Patricia
Current Estimated Value
Home Financials for this Owner
Home Financials are based on the most recent Mortgage that was taken out on this home.
Original Mortgage
$130,000
Interest Rate
7.43%
Mortgage Type
Purchase Money Mortgage
Create a Home Valuation Report for This Property
The Home Valuation Report is an in-depth analysis detailing your home's value as well as a comparison with similar homes in the area
Home Values in the Area
Average Home Value in this Area
Purchase History
| Date | Buyer | Sale Price | Title Company |
|---|---|---|---|
| Obrien Shawn | $139,500 | -- |
Source: Public Records
Mortgage History
| Date | Status | Borrower | Loan Amount |
|---|---|---|---|
| Open | Obrien Shawn | $155,000 | |
| Closed | Obrien Shawn | $150,000 | |
| Closed | Obrien Shawn | $130,000 |
Source: Public Records
Tax History
| Year | Tax Paid | Tax Assessment Tax Assessment Total Assessment is a certain percentage of the fair market value that is determined by local assessors to be the total taxable value of land and additions on the property. | Land | Improvement |
|---|---|---|---|---|
| 2025 | $6,160 | $543,200 | $177,900 | $365,300 |
| 2024 | $5,939 | $511,100 | $168,500 | $342,600 |
| 2023 | $5,688 | $454,700 | $156,000 | $298,700 |
| 2022 | $5,542 | $418,300 | $146,700 | $271,600 |
| 2021 | $5,596 | $405,500 | $146,700 | $258,800 |
| 2020 | $5,211 | $360,600 | $126,700 | $233,900 |
| 2019 | $5,182 | $343,200 | $120,500 | $222,700 |
| 2018 | $5,018 | $326,300 | $114,800 | $211,500 |
| 2017 | $4,636 | $292,300 | $93,600 | $198,700 |
| 2016 | $4,502 | $287,300 | $88,600 | $198,700 |
| 2015 | $4,385 | $267,200 | $79,900 | $187,300 |
Source: Public Records
Map
Nearby Homes
- 7 Fairfield St
- 185 Lafayette St Unit 3
- 5 Gardner St Unit 3
- 17 Palmer St
- 3 Chase St
- 22 Prescott St Unit 1
- 88 Congress St Unit 3
- 65 Palmer St Unit 3
- 6R Hazel Terrace Unit 1
- 10 Hazel St Unit 2
- 24 Norman St Unit 110
- 15 Phelps St Unit 1
- 25 Eden St Unit 2
- 16 Phelps St Unit 16-1
- 15 Francis Rd
- 11 Summer St
- 225 Derby St Unit 503
- 9 Glover St Unit 1
- 4 Willow Ave Unit 2
- 86 Wharf St Unit 6
- 23 Cedar St Unit 25
- 11 Cedar St
- 11 Cedar St Unit 3
- 11 Cedar St Unit 2
- 11 Cedar St Unit 1
- 4 Fairfield St
- 6 Fairfield St
- 31 Cedar St
- 2 Fairfield St
- 8 Fairfield St
- 2 Cedar St
- 20 Cedar St
- 182 Lafayette St Unit 11
- 176 Lafayette St Unit 14
- 22 Cherry St Unit 2
- 22 Cherry St Unit 1
- 22 Cherry St
- 18 Cherry St
- 35 Cedar St Unit 3
- 35 Cedar St Unit 2
Your Personal Tour Guide
Ask me questions while you tour the home.