
Seller's Agent in 2012
Jorge Sousa
Clearview Realty LLC
(203) 798-0158
2 in this area
96 Total Sales
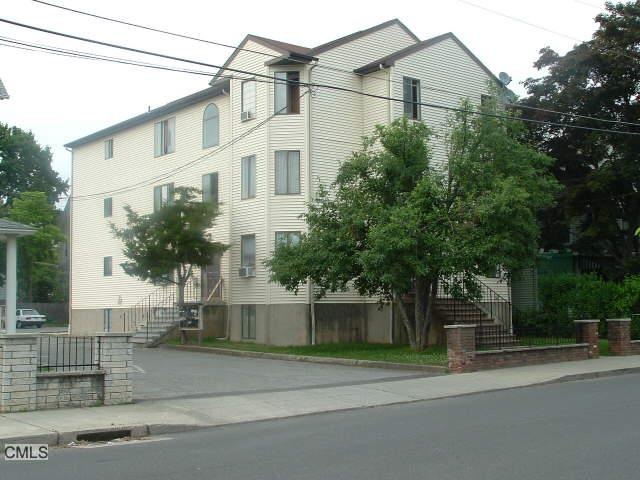
Nothing In Danbury With This Return! About $12000 Monthly Rental Income- 2 Buildings - Large 3 Family And Newer Building With 8 Large - 1 Bedr Units - All Rented - Excl Area For Rental Units - City Center
Last Agent to Sell the Property
Clearview Realty LLC License #REB.0759128 Listed on: 07/06/2012
| Date | Event | Price | List to Sale | Price per Sq Ft |
|---|---|---|---|---|
| 09/26/2012 09/26/12 | Sold | $978,000 | +0.3% | $320 / Sq Ft |
| 08/27/2012 08/27/12 | Pending | -- | -- | -- |
| 07/06/2012 07/06/12 | For Sale | $975,000 | -- | $319 / Sq Ft |
| Year | Tax Paid | Tax Assessment Tax Assessment Total Assessment is a certain percentage of the fair market value that is determined by local assessors to be the total taxable value of land and additions on the property. | Land | Improvement |
|---|---|---|---|---|
| 2025 | $12,042 | $481,880 | $61,320 | $420,560 |
| 2024 | $11,777 | $481,880 | $61,320 | $420,560 |
| 2023 | $11,242 | $481,880 | $61,320 | $420,560 |
| 2022 | $10,131 | $359,000 | $63,800 | $295,200 |
| 2021 | $9,908 | $359,000 | $63,800 | $295,200 |
| 2020 | $9,908 | $359,000 | $63,800 | $295,200 |
| 2019 | $9,908 | $359,000 | $63,800 | $295,200 |
| 2018 | $9,908 | $359,000 | $63,800 | $295,200 |
| 2017 | $6,824 | $235,700 | $60,800 | $174,900 |
| 2016 | $6,760 | $235,700 | $60,800 | $174,900 |
| 2015 | $6,661 | $235,700 | $60,800 | $174,900 |
| 2014 | $6,505 | $235,700 | $60,800 | $174,900 |
Seller's Agent in 2012
Jorge Sousa
Clearview Realty LLC
(203) 798-0158
2 in this area
96 Total Sales
Source: SmartMLS
MLS Number: 98545372
APN: DANB-000014I-000000-000386
Disclaimer: Certain information contained herein is derived from information provided by parties other than Homes.com. All information provided is deemed reliable, but is not guaranteed to be accurate and should be independently verified.
![]() IDX information is provided exclusively for personal, non-commercial use, and may not be used for any purpose other than to identify prospective properties consumers may be interested in purchasing. Information is deemed reliable but not guaranteed.
IDX information is provided exclusively for personal, non-commercial use, and may not be used for any purpose other than to identify prospective properties consumers may be interested in purchasing. Information is deemed reliable but not guaranteed.
Ask me questions while you tour the home.