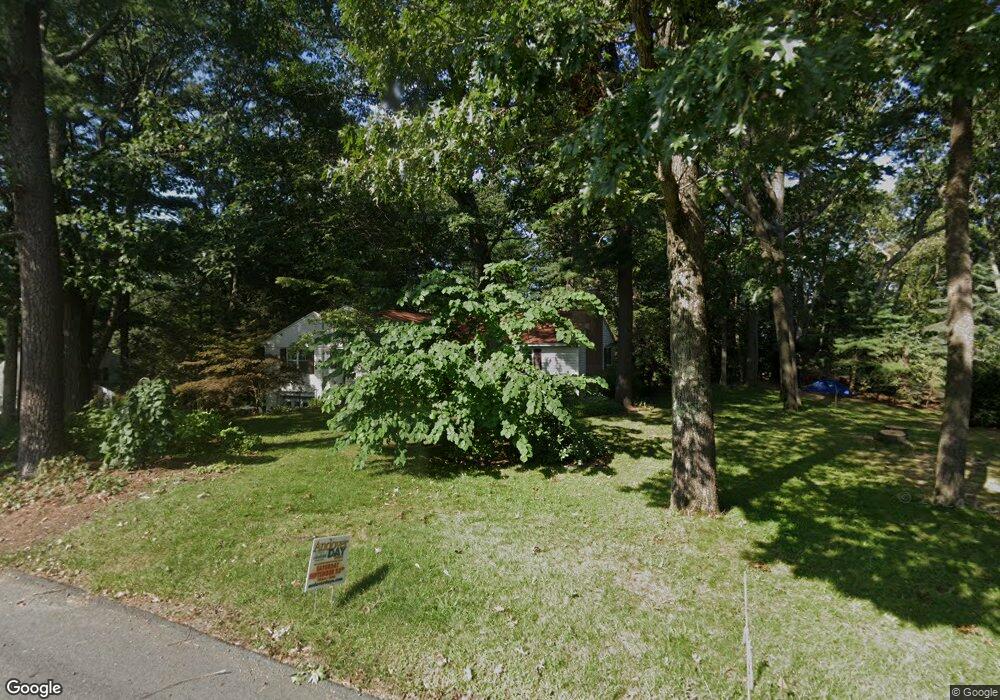
21 Chandler Rd Andover, MA 01810
Shawsheen Heights NeighborhoodEstimated Value: $814,745 - $870,000
3
Beds
2
Baths
1,986
Sq Ft
$424/Sq Ft
Est. Value
About This Home
This home is located at 21 Chandler Rd, Andover, MA 01810 and is currently estimated at $842,936, approximately $424 per square foot. 21 Chandler Rd is a home located in Essex County with nearby schools including West Elementary School, Wood Hill Middle School, and Willow River Secondary School.
Ownership History
Date
Name
Owned For
Owner Type
Purchase Details
Closed on
Dec 22, 2021
Sold by
R D Jr & M C Lindsey Lt
Bought by
Chandler Road T
Current Estimated Value
Purchase Details
Closed on
Mar 8, 2019
Sold by
Lindsay Richard D and Calkins-Lindsay Martha
Bought by
R D Jr & M C Lindsay Lt
Purchase Details
Closed on
Mar 21, 1980
Bought by
Lindsay Richard D and Calkins Martha
Create a Home Valuation Report for This Property
The Home Valuation Report is an in-depth analysis detailing your home's value as well as a comparison with similar homes in the area
Home Values in the Area
Average Home Value in this Area
Purchase History
| Date | Buyer | Sale Price | Title Company |
|---|---|---|---|
| Chandler Road T | $640,000 | None Available | |
| R D Jr & M C Lindsay Lt | -- | -- | |
| Lindsay Richard D | $86,500 | -- |
Source: Public Records
Mortgage History
| Date | Status | Borrower | Loan Amount |
|---|---|---|---|
| Previous Owner | Lindsay Richard D | $50,000 | |
| Previous Owner | Lindsay Richard D | $165,000 | |
| Previous Owner | Lindsay Richard D | $250,000 |
Source: Public Records
Tax History Compared to Growth
Tax History
| Year | Tax Paid | Tax Assessment Tax Assessment Total Assessment is a certain percentage of the fair market value that is determined by local assessors to be the total taxable value of land and additions on the property. | Land | Improvement |
|---|---|---|---|---|
| 2024 | $10,073 | $782,100 | $509,400 | $272,700 |
| 2023 | $9,625 | $704,600 | $458,900 | $245,700 |
| 2022 | $8,913 | $610,500 | $399,200 | $211,300 |
| 2021 | $8,515 | $556,900 | $363,100 | $193,800 |
| 2020 | $8,164 | $543,900 | $354,400 | $189,500 |
| 2019 | $8,058 | $527,700 | $343,900 | $183,800 |
| 2018 | $7,812 | $499,500 | $330,800 | $168,700 |
| 2017 | $7,461 | $491,500 | $324,300 | $167,200 |
| 2016 | $7,284 | $491,500 | $324,300 | $167,200 |
| 2015 | $7,024 | $469,200 | $311,700 | $157,500 |
Source: Public Records
Map
Nearby Homes
- 25 Clubview Dr Unit 25
- 13 Clubview Dr Unit 13
- 29 Glenwood Dr
- 37 Crenshaw Ln Unit 37
- 21 Clubview Dr Unit 21
- 0
- 96 Beacon St
- 5 Marc Ln
- 11 Devonshire St
- 10 Martingale Ln Unit 10
- 38 Lincoln Cir E
- 42 Beresford St
- 102 Weare St
- 6 Windsor St
- 33 Jefferson St
- 15 Beaconsfield St
- 54 Amherst St
- 34 Leeds Terrace
- 11 W Hawley St
- 5 W Kenneth St