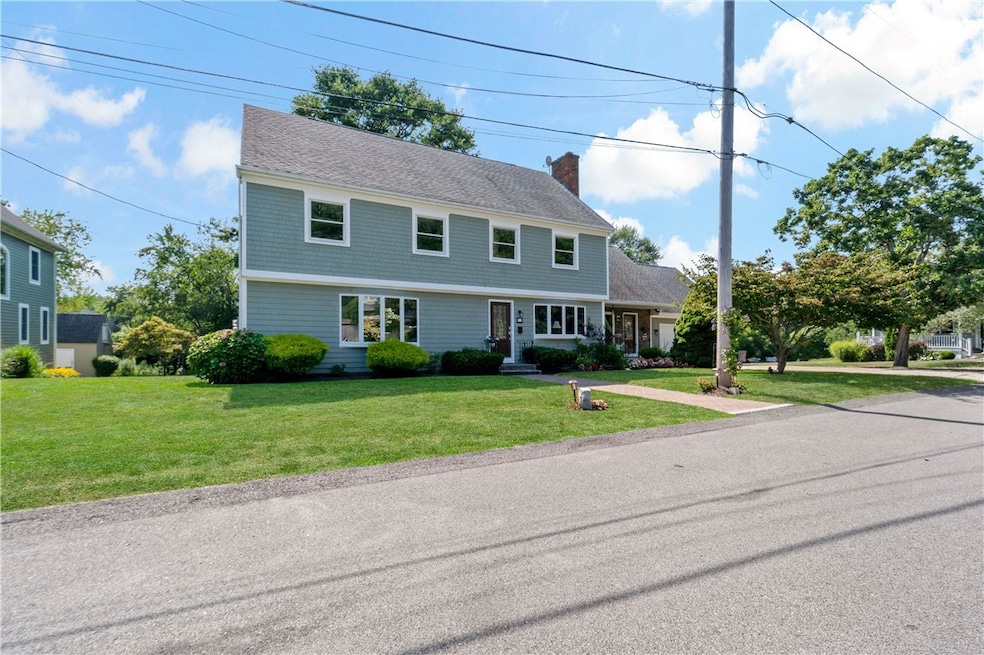


21 Clifton Rd Bristol, RI 02809
Bristol Highlands NeighborhoodHighlights
- Marina
- Beach Access
- Colonial Architecture
- Water Views
- Golf Course Community
- Cathedral Ceiling
About This Home
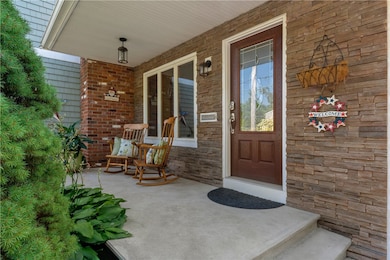
This well cared for one owner rental includes 5 bedroom, 3 full newly updated bathrooms, multiple living rooms. a mudroom and office space. This gem of a home sits in the heart of Bayside Shores on the west side of town. Throughout the home you will find meticulously maintained hardwood floors, fresh painted rooms and an immaculate kitchen including a gas range, 2 dishwashers and and breakfast nook with vaulted ceilings and large windows. The spacious great room has a gas fireplace, a large sliding glass door leading to a covered deck. Conveniently located adjacent to the East Bay Bike Path and within short walking distance to Colt State Park, public water access, Bristol Town Beach and all that downtown Bristol has to offer so close to home.

Home Details
Home Type
- Single Family
Year Built
- Built in 1966
Home Design
- Colonial Architecture
- Shingle Siding
Interior Spaces
- 3-Story Property
- Wet Bar
- Furnished
- Cathedral Ceiling
- Fireplace Features Masonry
- Gas Fireplace
- Mud Room
- Water Views
- Unfinished Basement
- Interior Basement Entry
- Attic
Kitchen
- Breakfast Area or Nook
- Oven
- Range
- Microwave
- Dishwasher
- Disposal
Flooring
- Wood
- Parquet
- Ceramic Tile
Bedrooms and Bathrooms
- 5 Bedrooms
- 3 Full Bathrooms
- Bathtub with Shower
Laundry
- Dryer
- Washer
Parking
- 4 Car Attached Garage
- Driveway
- Assigned Parking
Outdoor Features
- Beach Access
- Water Access
- Walking Distance to Water
- Mooring
- Patio
- Porch
Utilities
- Cooling System Mounted In Outer Wall Opening
- Window Unit Cooling System
- Central Air
- Heating System Uses Gas
- Heating System Uses Oil
Additional Features
- Accessible Doors
- Corner Lot
- Property near a hospital
Listing and Financial Details
- Property Available on 9/14/25
- 12 Month Lease Term
- Assessor Parcel Number 21CLIFTONRDBRIS
Community Details
Overview
- No Home Owners Association
- Bayside Shores/West Side Subdivision
Amenities
- Shops
- Restaurant
- Public Transportation
Recreation
- Marina
- Golf Course Community
- Tennis Courts
- Recreation Facilities
- Community Playground
Pet Policy
- No Pets Allowed
Map
Property History
| Date | Event | Price | List to Sale | Price per Sq Ft |
|---|---|---|---|---|
| 09/04/2025 09/04/25 | For Rent | $4,500 | -- | -- |
Source: State-Wide MLS
MLS Number: 1393979
APN: BRIS-000079-000000-000400
Disclaimer: Certain information contained herein is derived from information provided by parties other than Homes.com. All information provided is deemed reliable, but is not guaranteed to be accurate and should be independently verified.
![]() IDX information is provided exclusively for personal, non-commercial use, and may not be used for any purpose other than to identify prospective properties consumers may be interested in purchasing. Information is deemed reliable but not guaranteed.
IDX information is provided exclusively for personal, non-commercial use, and may not be used for any purpose other than to identify prospective properties consumers may be interested in purchasing. Information is deemed reliable but not guaranteed.
Copyright © 2025 State-Wide MLS, Inc. All rights reserved.
- 17 Shore Rd
- 61 Mulberry Rd
- 0 Surf Dr
- 40 Aaron Ave
- 1 Knowlton Ct
- 1220 Hope St
- 7 Knowlton Ct
- 3 Knowlton Ct
- 5 Knowlton Ct
- 413 High St
- 694 Hope St
- 107 Franklin St
- 21 Bradford St Unit 2
- 70 Magnolia St
- 669 Metacom Ave Unit 17
- 2 Wilson St
- 44 Bradford St Unit 48
- 44 Bradford St Unit 49
- 44 Bradford St Unit 52
- 2 Chilton St
- 825 Hope St
- 65 Sherry Ave
- 413 High St
- 692 Hope St Unit 2
- 103 Bayview Ave
- 103 Bayview Ave
- 11 Monroe Ave Unit 2
- 471 Wood St
- 20 State St Unit 4
- 4 Shaws Ln
- 227 Thames St Unit 1
- 227 Thames St
- 5 John St Unit 2
- 23 Rock St
- 59 Court St Unit 2W
- 18 Ryan Ave Unit 2N
- 5 Ryan Ave Unit 3
- 217 State St Unit 3 F
- 12 Easterbrooks Ave Unit 2
- 390 Metacom Ave Unit 206