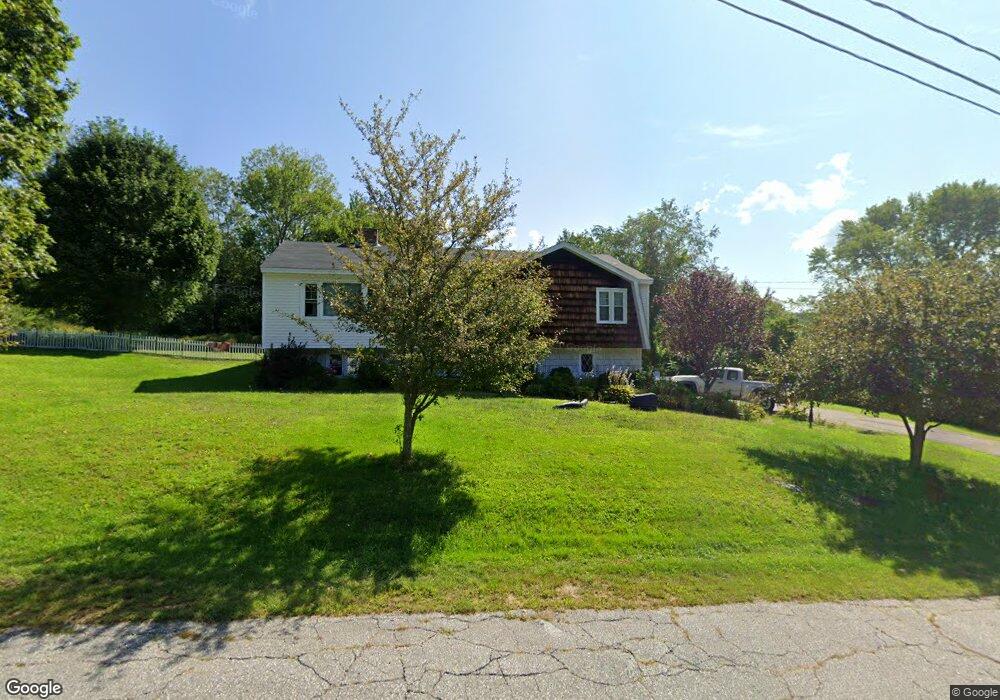
21 Colonial Dr Gilford, NH 03249
Estimated Value: $452,634 - $562,000
3
Beds
2
Baths
1,596
Sq Ft
$322/Sq Ft
Est. Value
About This Home
This home is located at 21 Colonial Dr, Gilford, NH 03249 and is currently estimated at $513,909, approximately $321 per square foot. 21 Colonial Dr is a home located in Belknap County with nearby schools including Gilford Elementary School, Gilford Middle School, and Gilford High School.
Ownership History
Date
Name
Owned For
Owner Type
Purchase Details
Closed on
Jul 12, 2005
Sold by
Ware Douglas M and Ware Carrie Steffick
Bought by
Bartlett David R and Bartlett Shannon J
Current Estimated Value
Home Financials for this Owner
Home Financials are based on the most recent Mortgage that was taken out on this home.
Original Mortgage
$205,000
Interest Rate
7%
Mortgage Type
Adjustable Rate Mortgage/ARM
Purchase Details
Closed on
Jul 2, 2003
Sold by
Imbimbo Steven J and Imbimbo Lauren E
Bought by
Ware Douglas M
Home Financials for this Owner
Home Financials are based on the most recent Mortgage that was taken out on this home.
Original Mortgage
$172,000
Interest Rate
5.46%
Mortgage Type
Purchase Money Mortgage
Purchase Details
Closed on
Feb 4, 2000
Sold by
Mello Frank and Mello Marilyn
Bought by
Imbimbo Steven and Imbimbo Lauren
Create a Home Valuation Report for This Property
The Home Valuation Report is an in-depth analysis detailing your home's value as well as a comparison with similar homes in the area
Home Values in the Area
Average Home Value in this Area
Purchase History
| Date | Buyer | Sale Price | Title Company |
|---|---|---|---|
| Bartlett David R | $250,000 | -- | |
| Ware Douglas M | $215,000 | -- | |
| Imbimbo Steven | $127,900 | -- |
Source: Public Records
Mortgage History
| Date | Status | Borrower | Loan Amount |
|---|---|---|---|
| Open | Imbimbo Steven | $201,900 | |
| Closed | Imbimbo Steven | $210,400 | |
| Closed | Imbimbo Steven | $23,000 | |
| Closed | Bartlett David R | $205,000 | |
| Previous Owner | Imbimbo Steven | $172,000 |
Source: Public Records
Tax History Compared to Growth
Tax History
| Year | Tax Paid | Tax Assessment Tax Assessment Total Assessment is a certain percentage of the fair market value that is determined by local assessors to be the total taxable value of land and additions on the property. | Land | Improvement |
|---|---|---|---|---|
| 2024 | $4,136 | $367,680 | $110,180 | $257,500 |
| 2023 | $3,700 | $359,180 | $110,180 | $249,000 |
| 2022 | $3,270 | $266,970 | $72,670 | $194,300 |
| 2021 | $3,278 | $266,970 | $72,670 | $194,300 |
| 2020 | $3,511 | $233,620 | $67,920 | $165,700 |
| 2019 | $3,326 | $209,700 | $39,300 | $170,400 |
| 2018 | $3,293 | $193,280 | $45,280 | $148,000 |
| 2017 | $3,308 | $191,680 | $45,280 | $146,400 |
| 2016 | $3,281 | $182,780 | $45,280 | $137,500 |
| 2015 | $3,202 | $178,190 | $43,790 | $134,400 |
| 2011 | $3,021 | $162,860 | $48,360 | $114,500 |
Source: Public Records
Map
Nearby Homes
- 6 Colonial Dr
- 7 Countryside Dr
- 162 Morrill St
- 233 Stark St
- 239 Gilford Ave
- 32 David Lewis Rd
- 0 Sanborn St Unit 8 5059863
- 102 Woodland Ave
- 74 Morrill St
- 122 Valley St
- 96 Clinton St
- 88 Stark St
- 75 Stark St Unit 3
- Lot 1 Winter St
- 468 Union Ave
- 26 Saint Catherine St
- 29 Strafford St
- 30 Beacon Hill Rd
- 84 Spring St
- 284 Pine St