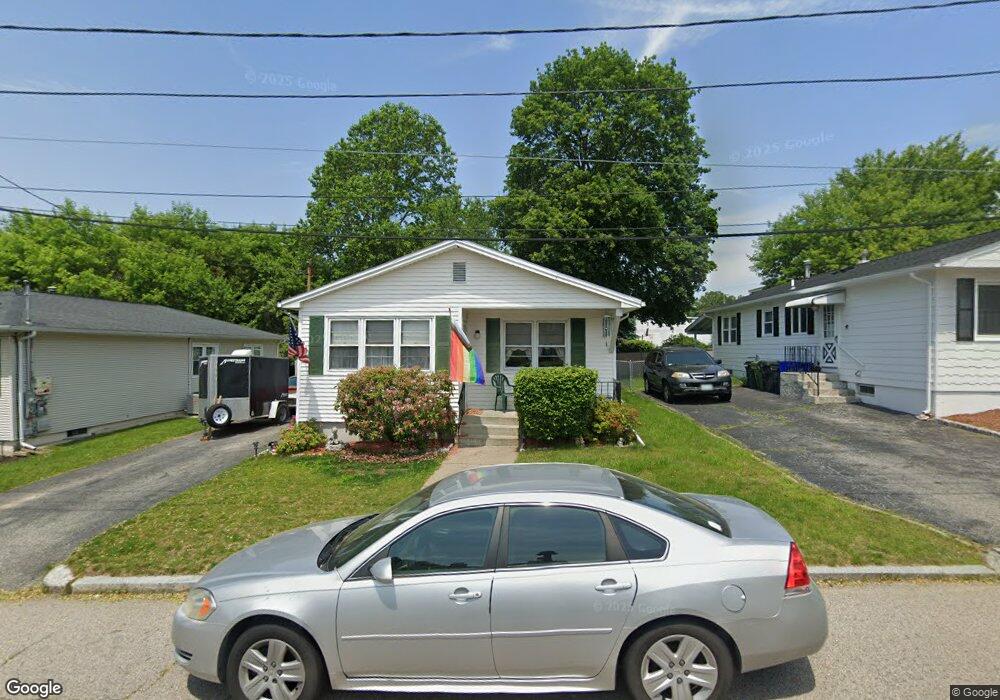
21 Compton St Providence, RI 02908
Mount Pleasant NeighborhoodEstimated Value: $386,000 - $414,000
3
Beds
1
Bath
1,077
Sq Ft
$368/Sq Ft
Est. Value
About This Home
This home is located at 21 Compton St, Providence, RI 02908 and is currently estimated at $396,433, approximately $368 per square foot. 21 Compton St is a home located in Providence County with nearby schools including St. Augustine School, St. Pius V Catholic School, and Mount Pleasant Academy.
Ownership History
Date
Name
Owned For
Owner Type
Purchase Details
Closed on
Nov 1, 2023
Sold by
Isherwood Linda R
Bought by
Isherwood Bernard T and Isherwood Linda R
Current Estimated Value
Purchase Details
Closed on
Aug 14, 1996
Sold by
Kwiatowski Gregory E and Kwiatowski Ellen
Bought by
Isherwood Linda R
Home Financials for this Owner
Home Financials are based on the most recent Mortgage that was taken out on this home.
Original Mortgage
$65,000
Interest Rate
8.08%
Mortgage Type
Purchase Money Mortgage
Create a Home Valuation Report for This Property
The Home Valuation Report is an in-depth analysis detailing your home's value as well as a comparison with similar homes in the area
Home Values in the Area
Average Home Value in this Area
Purchase History
| Date | Buyer | Sale Price | Title Company |
|---|---|---|---|
| Isherwood Bernard T | -- | None Available | |
| Isherwood Linda R | $85,000 | -- |
Source: Public Records
Mortgage History
| Date | Status | Borrower | Loan Amount |
|---|---|---|---|
| Previous Owner | Isherwood Linda R | $65,000 |
Source: Public Records
Tax History
| Year | Tax Paid | Tax Assessment Tax Assessment Total Assessment is a certain percentage of the fair market value that is determined by local assessors to be the total taxable value of land and additions on the property. | Land | Improvement |
|---|---|---|---|---|
| 2025 | $3,039 | $361,800 | $160,400 | $201,400 |
| 2024 | $5,101 | $278,000 | $104,300 | $173,700 |
| 2023 | $5,101 | $278,000 | $104,300 | $173,700 |
| 2022 | $4,948 | $278,000 | $104,300 | $173,700 |
| 2021 | $4,907 | $199,800 | $80,100 | $119,700 |
| 2020 | $4,907 | $199,800 | $80,100 | $119,700 |
| 2019 | $4,907 | $199,800 | $80,100 | $119,700 |
| 2018 | $4,305 | $134,700 | $64,400 | $70,300 |
| 2017 | $4,305 | $134,700 | $64,400 | $70,300 |
| 2016 | $4,305 | $134,700 | $64,400 | $70,300 |
| 2015 | $4,214 | $127,300 | $64,400 | $62,900 |
| 2014 | $4,296 | $127,300 | $64,400 | $62,900 |
| 2013 | $4,296 | $127,300 | $64,400 | $62,900 |
Source: Public Records
Map
Nearby Homes
- 1189 Smith St
- 84 Enfield Ave
- 68 Enfield Ave
- 31 Elmcrest Ave
- 46 Longwood Ave
- 112 Longwood Ave
- 116 Longwood Ave
- 797 Academy Ave
- 36 Walton St
- 354 Jastram St
- 299 Jastram St
- 165 Whitford Ave
- 119 Farm St
- 73 High Service Ave
- 493 Academy Ave
- 507 Sharon St
- 41 Wellesley Ave
- 616 River Ave
- 21 Webb St
- 39 Hillview Ave
Your Personal Tour Guide
Ask me questions while you tour the home.