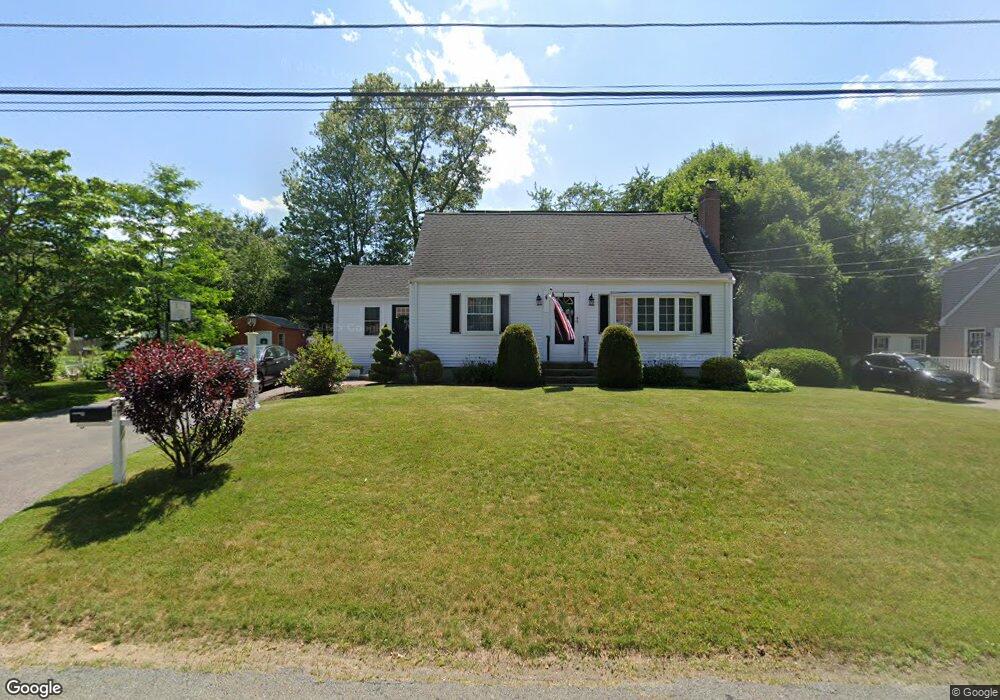
21 Dartmouth Rd Walpole, MA 02081
Estimated Value: $664,000 - $761,000
3
Beds
2
Baths
1,428
Sq Ft
$490/Sq Ft
Est. Value
About This Home
This home is located at 21 Dartmouth Rd, Walpole, MA 02081 and is currently estimated at $699,783, approximately $490 per square foot. 21 Dartmouth Rd is a home located in Norfolk County with nearby schools including Elm Street School, Eleanor N. Johnson Middle School, and Walpole High School.
Ownership History
Date
Name
Owned For
Owner Type
Purchase Details
Closed on
Dec 30, 2005
Sold by
Kubit Kathleen M and Ferellec William M
Bought by
Da-Silva Dino F and Da-Silva Rosa M
Current Estimated Value
Home Financials for this Owner
Home Financials are based on the most recent Mortgage that was taken out on this home.
Original Mortgage
$308,000
Outstanding Balance
$174,346
Interest Rate
6.39%
Mortgage Type
Purchase Money Mortgage
Estimated Equity
$525,437
Create a Home Valuation Report for This Property
The Home Valuation Report is an in-depth analysis detailing your home's value as well as a comparison with similar homes in the area
Home Values in the Area
Average Home Value in this Area
Purchase History
| Date | Buyer | Sale Price | Title Company |
|---|---|---|---|
| Da-Silva Dino F | $385,000 | -- |
Source: Public Records
Mortgage History
| Date | Status | Borrower | Loan Amount |
|---|---|---|---|
| Open | Da-Silva Dino F | $308,000 | |
| Previous Owner | Da-Silva Dino F | $70,000 |
Source: Public Records
Tax History Compared to Growth
Tax History
| Year | Tax Paid | Tax Assessment Tax Assessment Total Assessment is a certain percentage of the fair market value that is determined by local assessors to be the total taxable value of land and additions on the property. | Land | Improvement |
|---|---|---|---|---|
| 2025 | $7,246 | $564,800 | $316,100 | $248,700 |
| 2024 | $7,044 | $532,800 | $303,900 | $228,900 |
| 2023 | $6,855 | $493,500 | $264,300 | $229,200 |
| 2022 | $6,480 | $448,100 | $244,800 | $203,300 |
| 2021 | $6,111 | $411,800 | $230,900 | $180,900 |
| 2020 | $6,086 | $406,000 | $217,800 | $188,200 |
| 2019 | $5,889 | $390,000 | $209,400 | $180,600 |
| 2018 | $5,456 | $357,300 | $201,400 | $155,900 |
| 2017 | $5,275 | $344,100 | $193,700 | $150,400 |
| 2016 | $5,149 | $330,900 | $186,200 | $144,700 |
| 2015 | $4,792 | $305,200 | $177,100 | $128,100 |
| 2014 | $4,610 | $292,500 | $177,100 | $115,400 |
Source: Public Records
Map
Nearby Homes
- 1648 Main St
- 1391 Main St Unit 304
- 1391 Main St Unit 208
- 1391 Main St Unit 305
- 1391 Main St Unit 308
- 66 Oak St
- 13 Sandtrap Cir Unit 14
- 11 Sandtrap Cir Unit 15
- 20 Sandtrap Cir Unit 4
- 18 Sandtrap Cir Unit 3
- 17 Sandtrap Cir Unit 12
- 15 Sandtrap Cir Unit 13
- 10 Sandtrap Cir Unit 2
- 31 Sandtrap Cir Unit 5
- 8 Autumn Ln
- 127 Clear Pond Dr
- 137 Clear Pond Dr
- 16 Magpie Cir Unit 16
- 18 Teal Cir
- 14 Tiger Terrace Unit 29