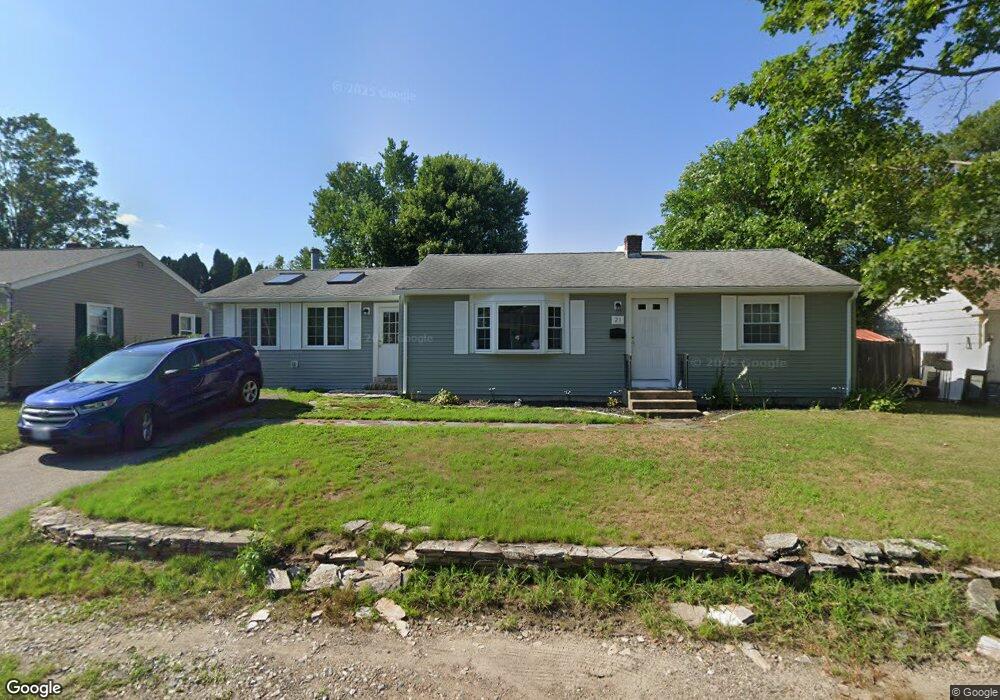
21 Dawson Ave Warwick, RI 02888
Palace Garden NeighborhoodEstimated Value: $393,000 - $443,000
3
Beds
2
Baths
1,864
Sq Ft
$226/Sq Ft
Est. Value
About This Home
This home is located at 21 Dawson Ave, Warwick, RI 02888 and is currently estimated at $420,374, approximately $225 per square foot. 21 Dawson Ave is a home located in Kent County with nearby schools including St. Peter School and Saint Paul School.
Ownership History
Date
Name
Owned For
Owner Type
Purchase Details
Closed on
Apr 2, 2003
Sold by
Sanford David F and Sanford Deborah L
Bought by
Kazen George W and Kazen Kathleen M
Current Estimated Value
Home Financials for this Owner
Home Financials are based on the most recent Mortgage that was taken out on this home.
Original Mortgage
$165,300
Interest Rate
5.88%
Mortgage Type
Purchase Money Mortgage
Create a Home Valuation Report for This Property
The Home Valuation Report is an in-depth analysis detailing your home's value as well as a comparison with similar homes in the area
Home Values in the Area
Average Home Value in this Area
Purchase History
| Date | Buyer | Sale Price | Title Company |
|---|---|---|---|
| Kazen George W | $144,000 | -- |
Source: Public Records
Mortgage History
| Date | Status | Borrower | Loan Amount |
|---|---|---|---|
| Open | Kazen George W | $184,020 | |
| Closed | Kazen George W | $212,000 | |
| Closed | Kazen George W | $195,500 | |
| Closed | Kazen George W | $165,300 |
Source: Public Records
Tax History Compared to Growth
Tax History
| Year | Tax Paid | Tax Assessment Tax Assessment Total Assessment is a certain percentage of the fair market value that is determined by local assessors to be the total taxable value of land and additions on the property. | Land | Improvement |
|---|---|---|---|---|
| 2025 | $4,578 | $360,500 | $114,700 | $245,800 |
| 2024 | $4,426 | $305,900 | $99,700 | $206,200 |
| 2023 | $4,341 | $305,900 | $99,700 | $206,200 |
| 2022 | $4,104 | $219,100 | $64,500 | $154,600 |
| 2021 | $4,104 | $219,100 | $64,500 | $154,600 |
| 2020 | $4,104 | $219,100 | $64,500 | $154,600 |
| 2019 | $4,104 | $219,100 | $64,500 | $154,600 |
| 2018 | $3,582 | $172,200 | $64,500 | $107,700 |
| 2017 | $3,485 | $172,200 | $64,500 | $107,700 |
| 2016 | $3,485 | $172,200 | $64,500 | $107,700 |
| 2015 | $3,245 | $156,400 | $57,200 | $99,200 |
| 2014 | $3,137 | $156,400 | $57,200 | $99,200 |
| 2013 | $3,095 | $156,400 | $57,200 | $99,200 |
Source: Public Records
Map
Nearby Homes
- 23 Stoddard Place
- 63 Benbridge Ave
- 117 Spring Green Rd
- 110 Pilgrim Pkwy Unit 8
- 788 Namquid Dr
- 161 N Country Club Dr
- 845 Warwick Ave
- 922 Narragansett Pkwy
- 56 Errol St
- 40 Easton Ave
- 196 Harrison Ave
- 56 Partition St
- 208 Negansett Ave
- 93 Easton Ave
- 111 Aster St
- 6 Black Creek Ln
- 165 Merrymount Dr
- 126 Fairfax Dr
- 169 Partition St
- 95 Roosevelt St